Fig. 8
Download original image
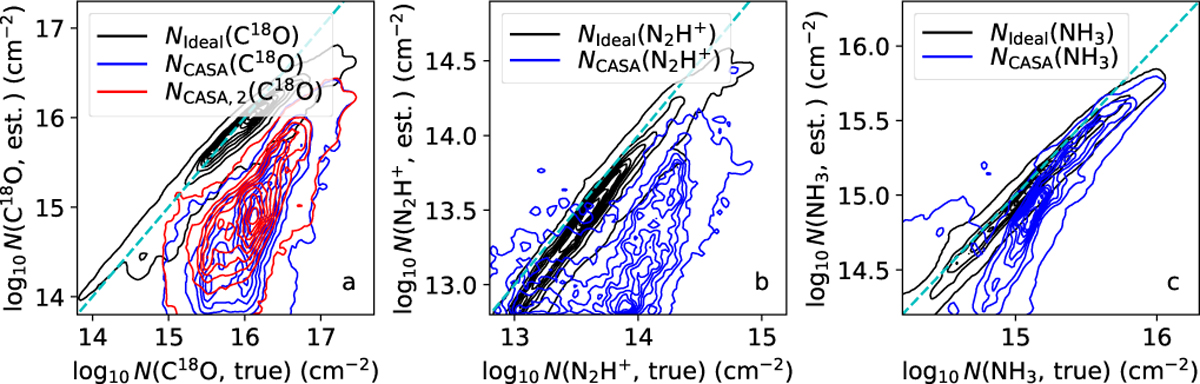
Correlations between column density estimates and the true column density. The y-axis shows the ideal and simulated ngVLA estimates, and the x-axis the true model column density of the molecule in question. Results are shown for C18O, N2H+, and NH3. These correspond to the maps in Fig. 1, with the addition of C18O estimates based on the fitting of two Gaussian velocity components (NCASA2 in frame a). There are nine linearly spaced contour levels, up to the maximum point density (pixels per logarithmic intervals of true and observed column density).
Current usage metrics show cumulative count of Article Views (full-text article views including HTML views, PDF and ePub downloads, according to the available data) and Abstracts Views on Vision4Press platform.
Data correspond to usage on the plateform after 2015. The current usage metrics is available 48-96 hours after online publication and is updated daily on week days.
Initial download of the metrics may take a while.