Fig. 7
Download original image
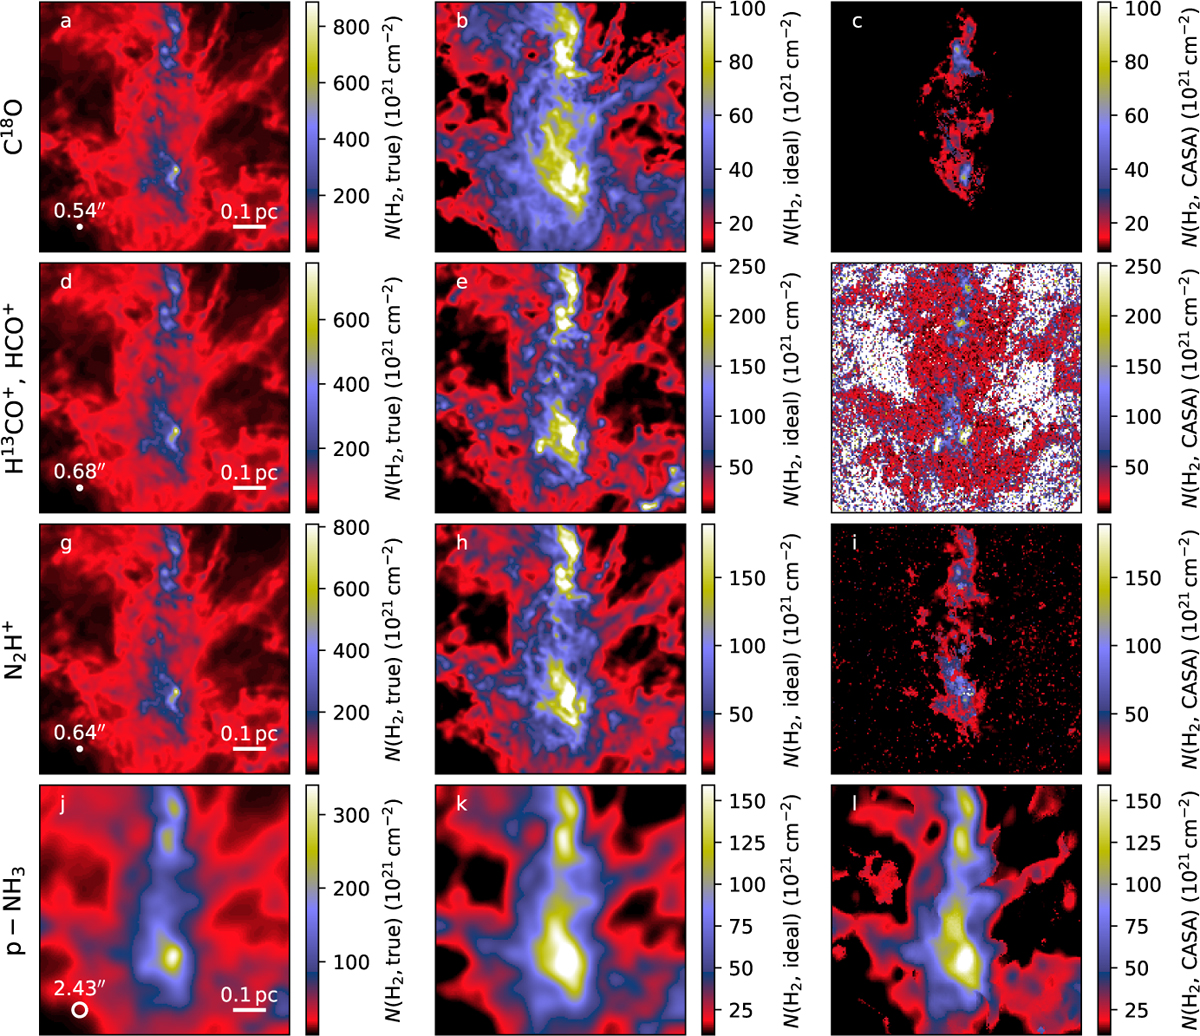
Comparison of true and estimated column densities. The three columns correspond to the true column density, the column density estimated from ideal observations, and the column density derived from the nominal synthetic ngVLA observations. Results are shown for C18O (first row; optically thin approximation), combination of H13CO+ and HCO+ lines (second row), N2H+ (third row; fit of hyperfine structure), and NH3 (bottom row; fit of hyperfine structure). Observational estimates have been scaled to N(H2) using the maximum fractional-abundance value in the modelling. In the first column, the true column densities are also correspondingly scaled down according to the spatial variation of the relative abundances.
Current usage metrics show cumulative count of Article Views (full-text article views including HTML views, PDF and ePub downloads, according to the available data) and Abstracts Views on Vision4Press platform.
Data correspond to usage on the plateform after 2015. The current usage metrics is available 48-96 hours after online publication and is updated daily on week days.
Initial download of the metrics may take a while.