Fig. 6
Download original image
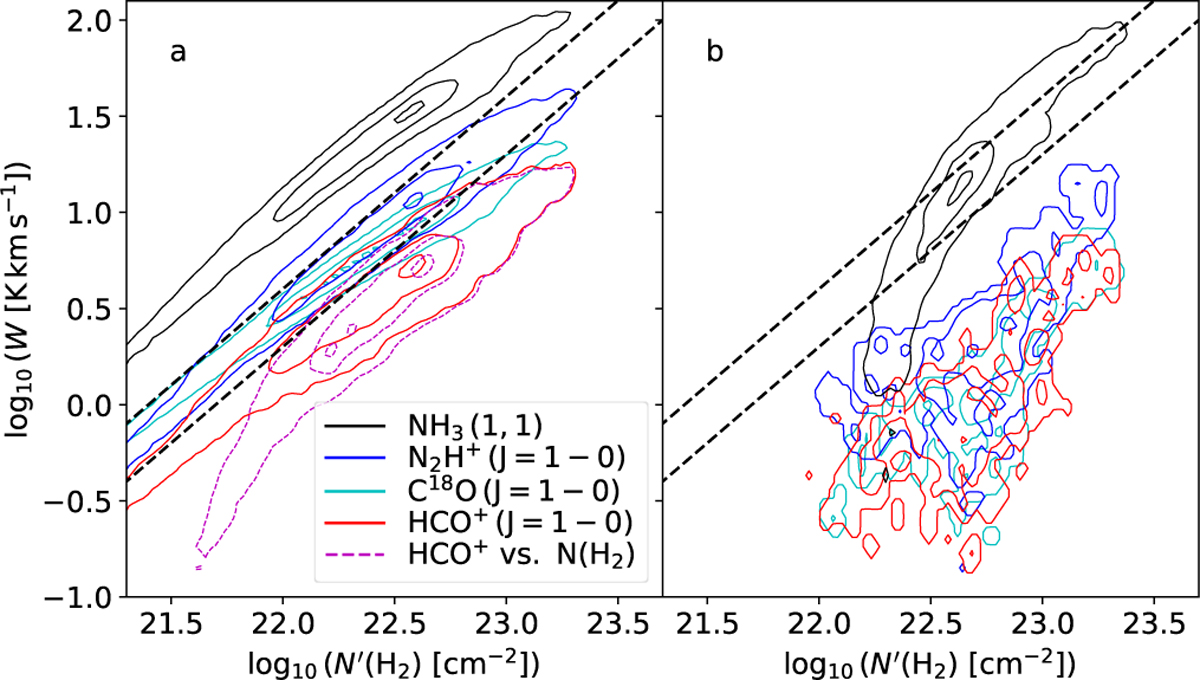
Integrated intensities of selected molecules as a function of N′(H2), which is the true model column density that has been scaled to take into account the density dependence of molecular abundances. Frame a shows the data for ideal observations (full model resolution) and frame b for the simulated ngVLA observations (resolution of ngVLA data). The contours are drawn at 10%, 50%, and 90% of the peak point density (pixels per logarithmic column-density and line-area interval). For HCO+ in frame a, the distribution is plotted also against N(H2), showing the effect of lower average abundances at lower densities. For reference, the dashed black lines show two linear relationships that are separated by a factor of two along the W axis: W = 2 × 10⁻²² × N′(H2) K km s−1 and W = 4× 10⁻²² × N′(H2) K kms−1.
Current usage metrics show cumulative count of Article Views (full-text article views including HTML views, PDF and ePub downloads, according to the available data) and Abstracts Views on Vision4Press platform.
Data correspond to usage on the plateform after 2015. The current usage metrics is available 48-96 hours after online publication and is updated daily on week days.
Initial download of the metrics may take a while.