Open Access
Fig. 5
Download original image
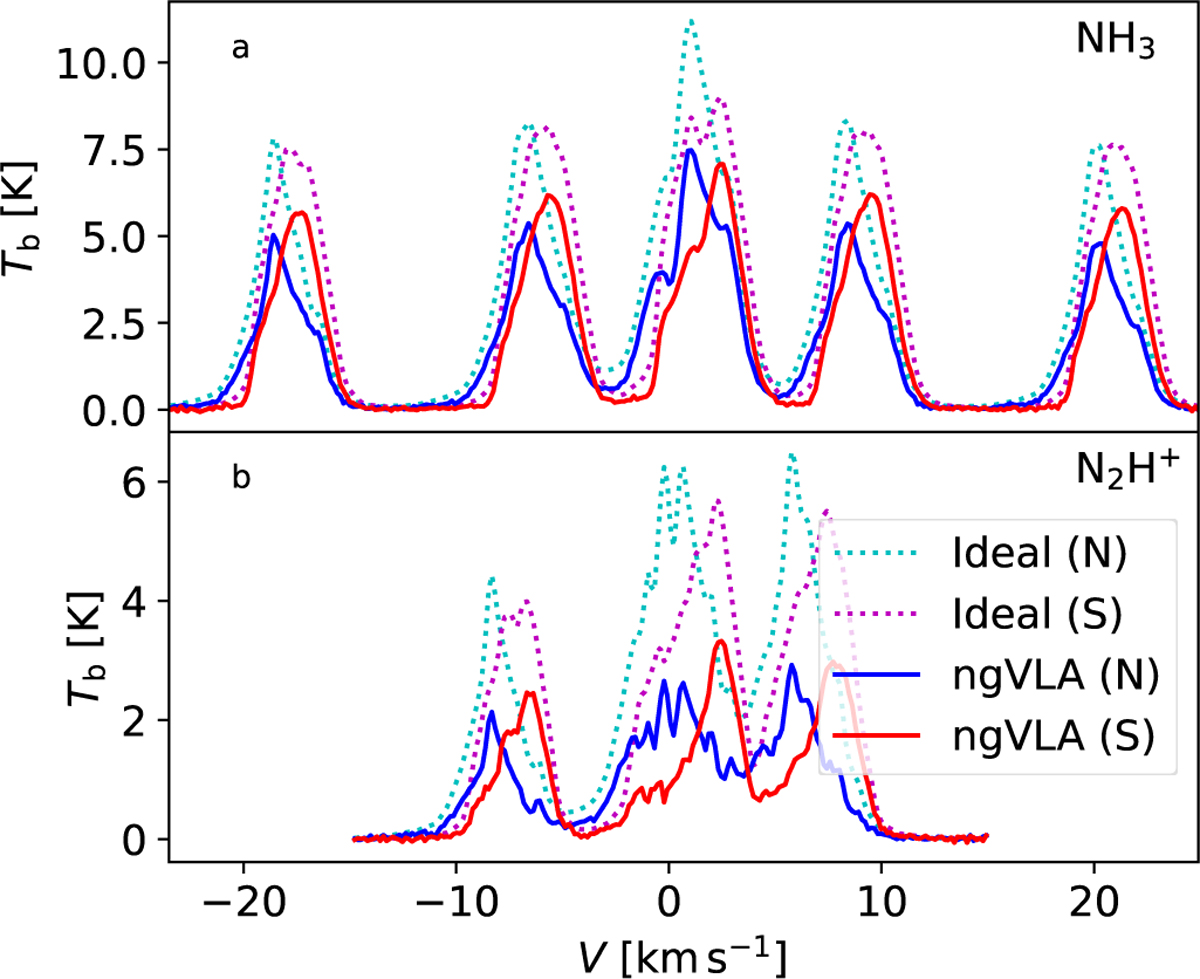
Average ideal and ngVLA-observed NH3 and N2H+ spectra towards the northern (N) and the southern (S) clumps. The dotted lines correspond to ideal observations and the solid lines to the nominal synthetic ngVLA observations.
Current usage metrics show cumulative count of Article Views (full-text article views including HTML views, PDF and ePub downloads, according to the available data) and Abstracts Views on Vision4Press platform.
Data correspond to usage on the plateform after 2015. The current usage metrics is available 48-96 hours after online publication and is updated daily on week days.
Initial download of the metrics may take a while.