Fig. D.2
Download original image
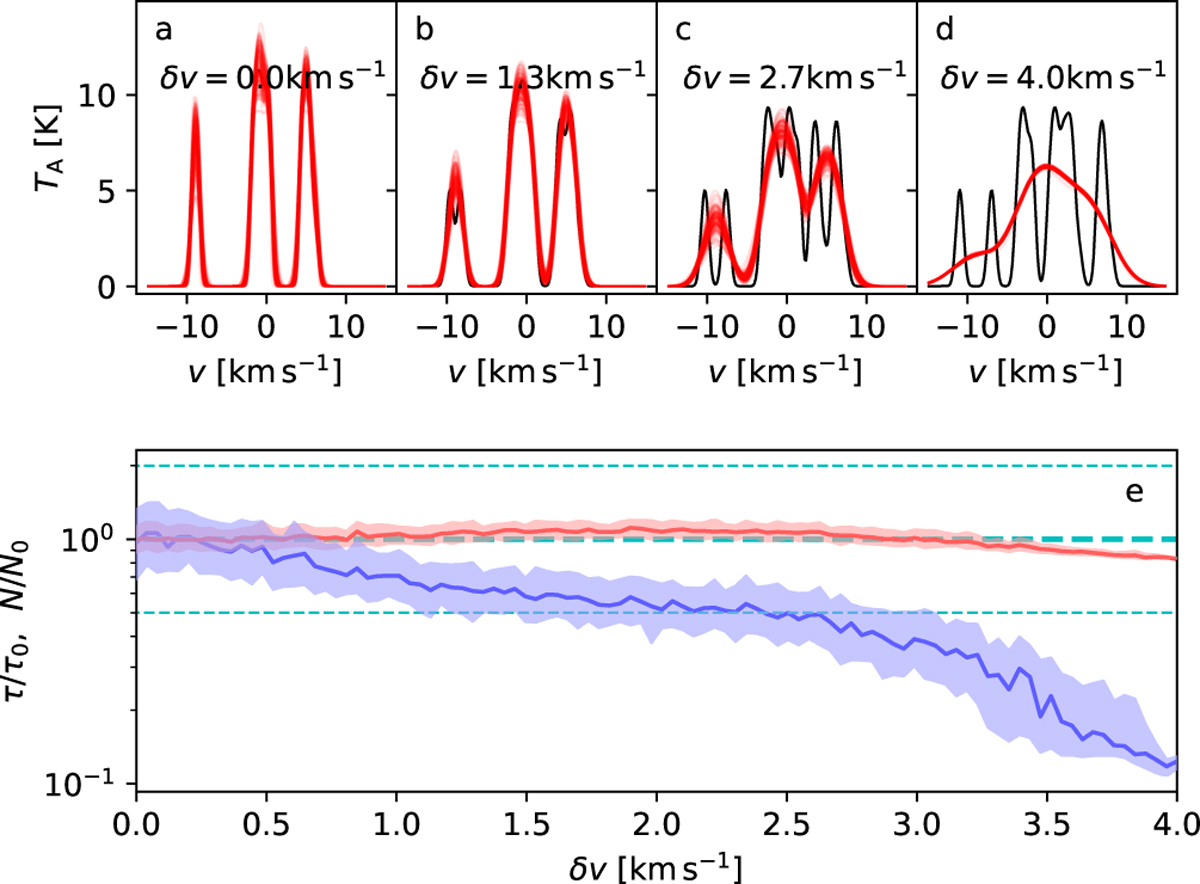
Test of fitting N2H+ observations containing two velocity components. The upper frames show simulated spectra (black lines) with 0.3 K observational noise and varying velocity difference δυ between the two components. Fits of a single velocity component are plotted in red for a number of noise realisations. The lower frame shows the recovered optical depth (blue line) and column density (red line) as a function of the velocity offset δυ. The shaded regions correspond to the inter-quartile range, which is computed from 128 noise realisations. The y-axis shows the ratio between the estimates and the true values.
Current usage metrics show cumulative count of Article Views (full-text article views including HTML views, PDF and ePub downloads, according to the available data) and Abstracts Views on Vision4Press platform.
Data correspond to usage on the plateform after 2015. The current usage metrics is available 48-96 hours after online publication and is updated daily on week days.
Initial download of the metrics may take a while.