Open Access
Fig. D.1
Download original image
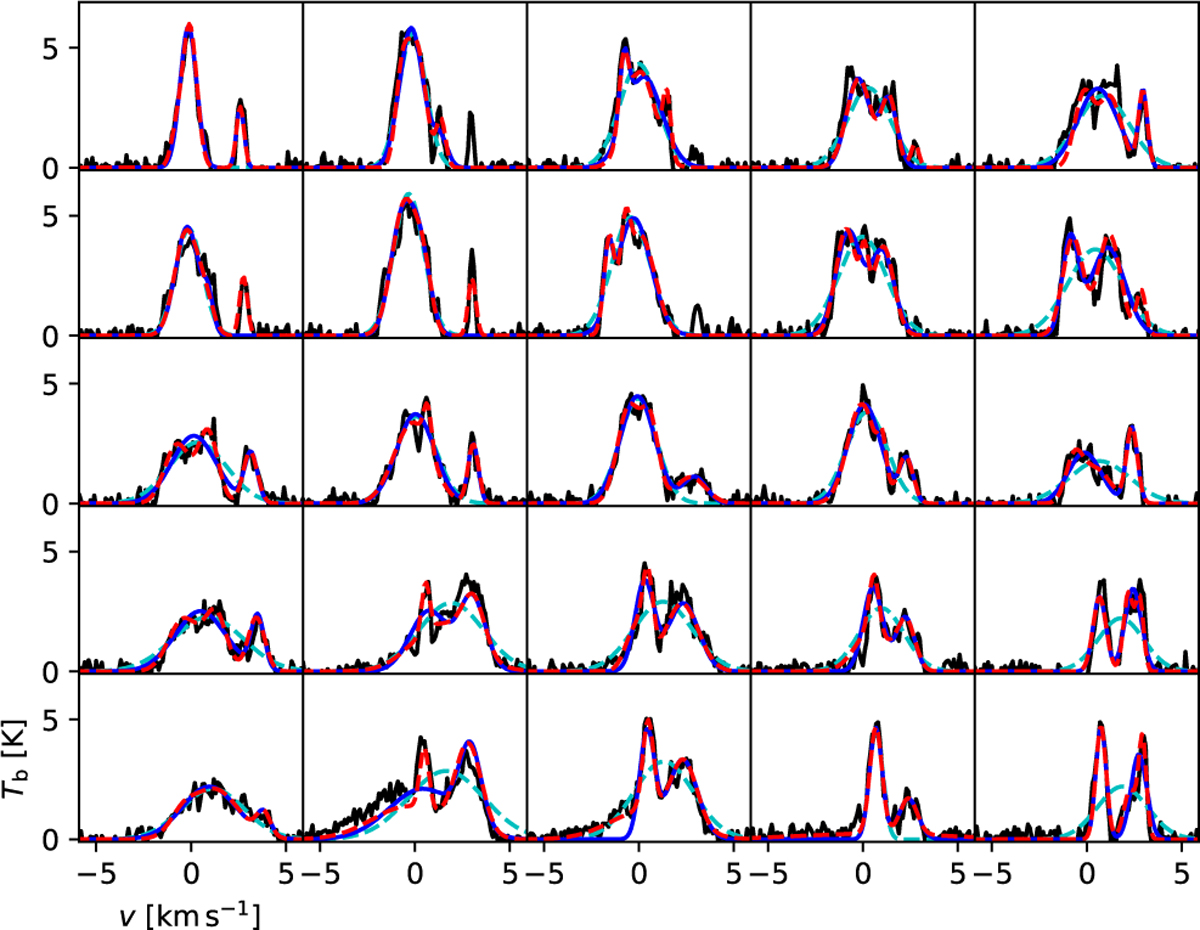
Examples of Gaussian fits towards the northern core, for simulated C18O observations (black lines) with the ngVLA Core configuration. The fits with one, two, and three Gaussian components are plotted with cyan, blue, and red lines, respectively. The spectra are taken at steps of FWHM, equal to 0.54″.
Current usage metrics show cumulative count of Article Views (full-text article views including HTML views, PDF and ePub downloads, according to the available data) and Abstracts Views on Vision4Press platform.
Data correspond to usage on the plateform after 2015. The current usage metrics is available 48-96 hours after online publication and is updated daily on week days.
Initial download of the metrics may take a while.