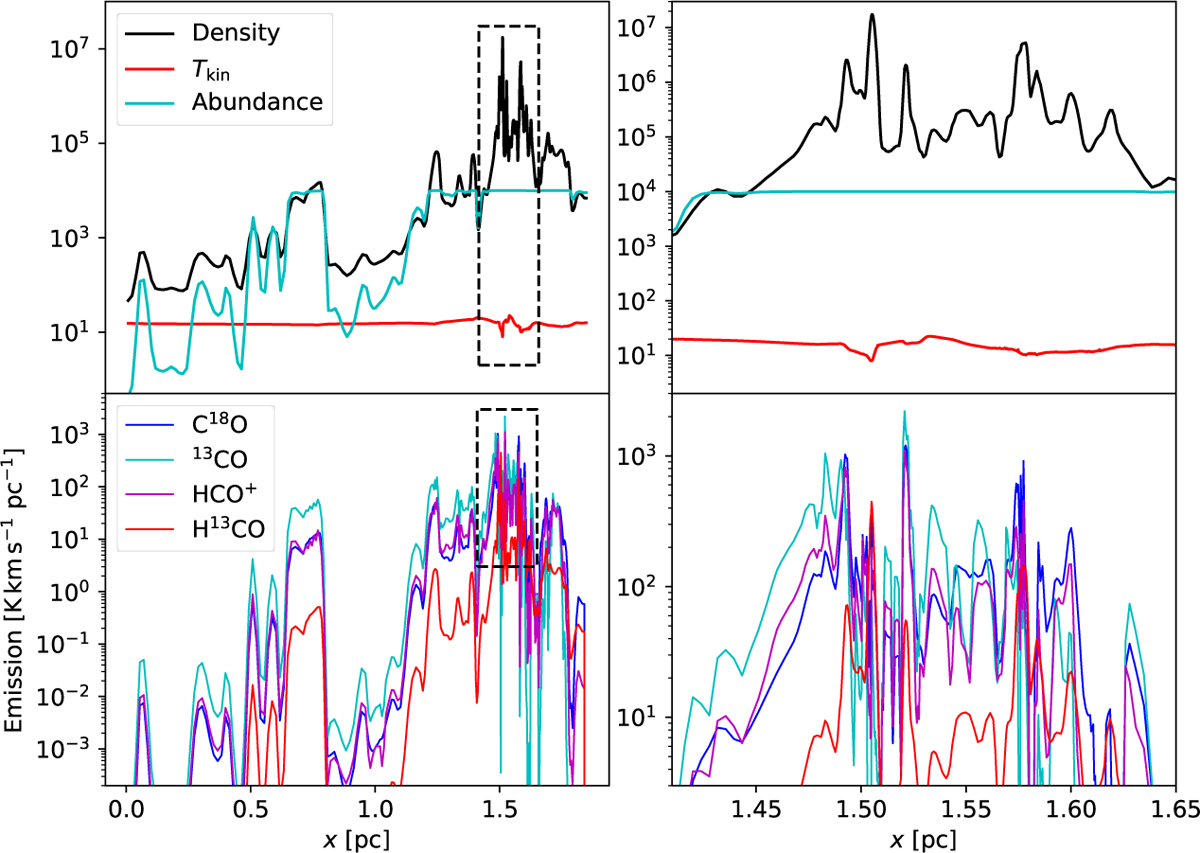
Fig. B.3
Download original image
Parameters along the LOS towards the position indicated by the northernmost cross in Fig. B.2. The first frame shows the density (black line), abundance (arbitrary normalisation and cyan line), and kinetic temperature (red line). Frame b shows same data with a zoom-in to the dashed box in frame a. The bottom frames shows the contributions of different LOS regions to the observed spectra (integrated line intensity).
Current usage metrics show cumulative count of Article Views (full-text article views including HTML views, PDF and ePub downloads, according to the available data) and Abstracts Views on Vision4Press platform.
Data correspond to usage on the plateform after 2015. The current usage metrics is available 48-96 hours after online publication and is updated daily on week days.
Initial download of the metrics may take a while.