Fig. B.2
Download original image
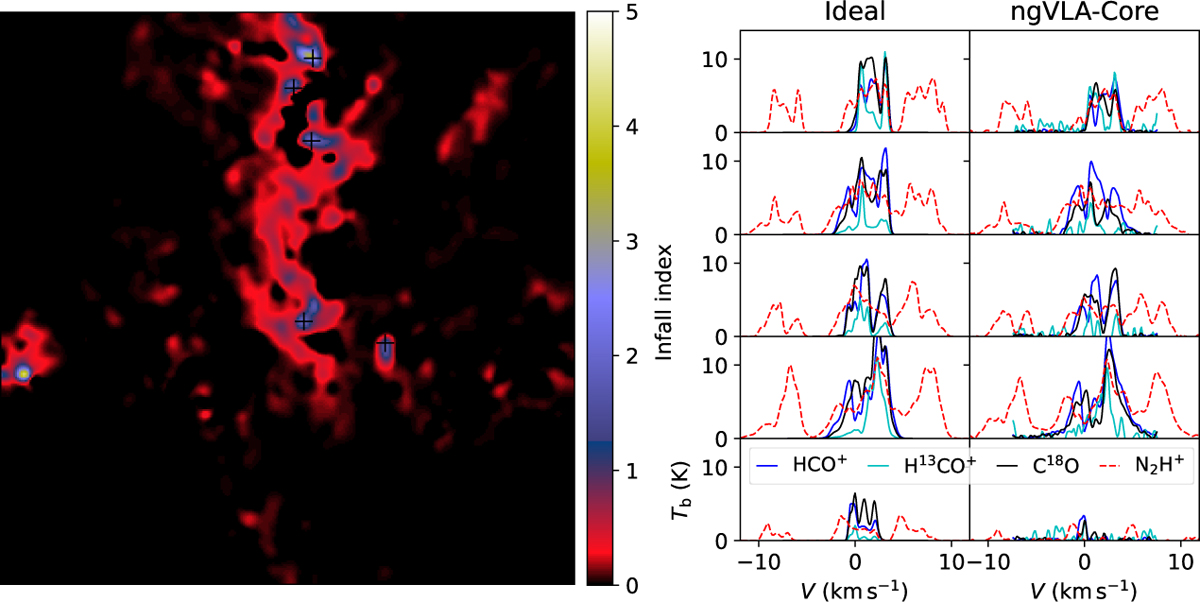
Spectra for selected LOS with strong inflow motions. The first frame shows the inflow index ξ convolved to 1″ resolution. Crosses mark five locations with large ξ values, and the plots on the right show spectra for these positions (rows in decreasing order of latitude). Spectra in the first column correspond to ideal observations and the spectra in the second column to simulated ngVLA observations. Spectra are plotted for C18O (black lines), HCO+ (blue), H13CO+ (cyan), and N2H+ (dashed red lines).
Current usage metrics show cumulative count of Article Views (full-text article views including HTML views, PDF and ePub downloads, according to the available data) and Abstracts Views on Vision4Press platform.
Data correspond to usage on the plateform after 2015. The current usage metrics is available 48-96 hours after online publication and is updated daily on week days.
Initial download of the metrics may take a while.