Open Access
Fig. A.1
Download original image
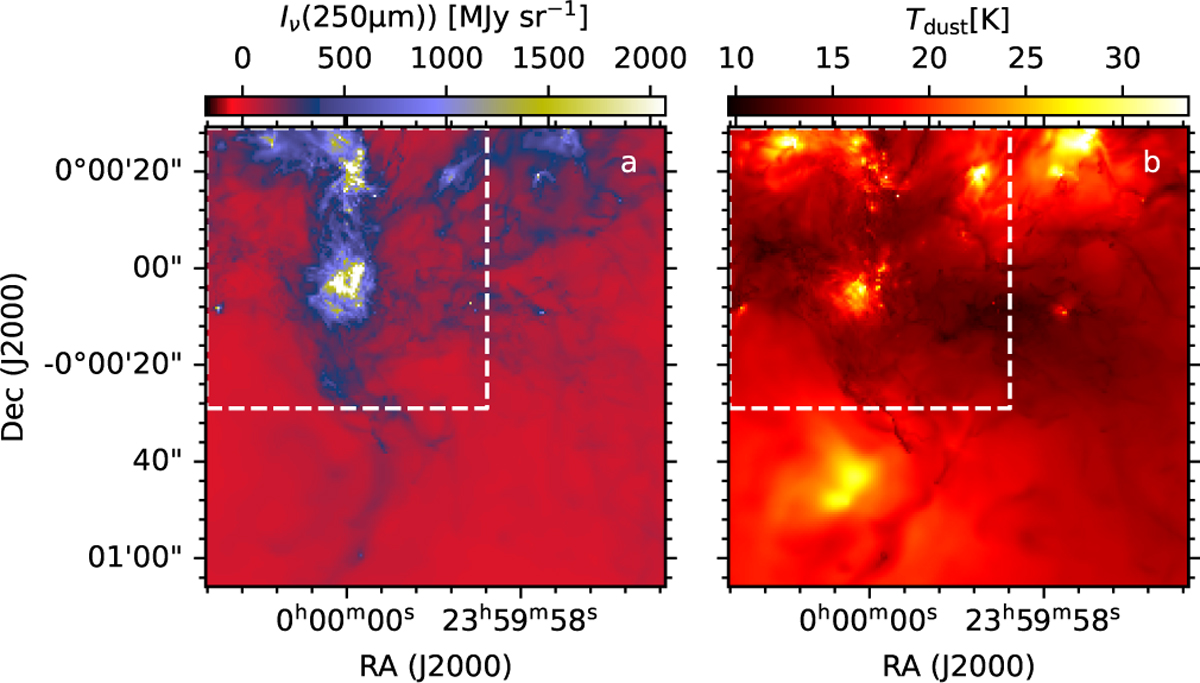
Maps of dust emission at 250 µm (left frame) and dust colour temperature (right frame). The dashed line shows the area discussed in the main part of the paper. The data correspond to the full resolution of the cloud model (using 0.05″ pixel size for the plot).
Current usage metrics show cumulative count of Article Views (full-text article views including HTML views, PDF and ePub downloads, according to the available data) and Abstracts Views on Vision4Press platform.
Data correspond to usage on the plateform after 2015. The current usage metrics is available 48-96 hours after online publication and is updated daily on week days.
Initial download of the metrics may take a while.