Fig. 20

Download original image
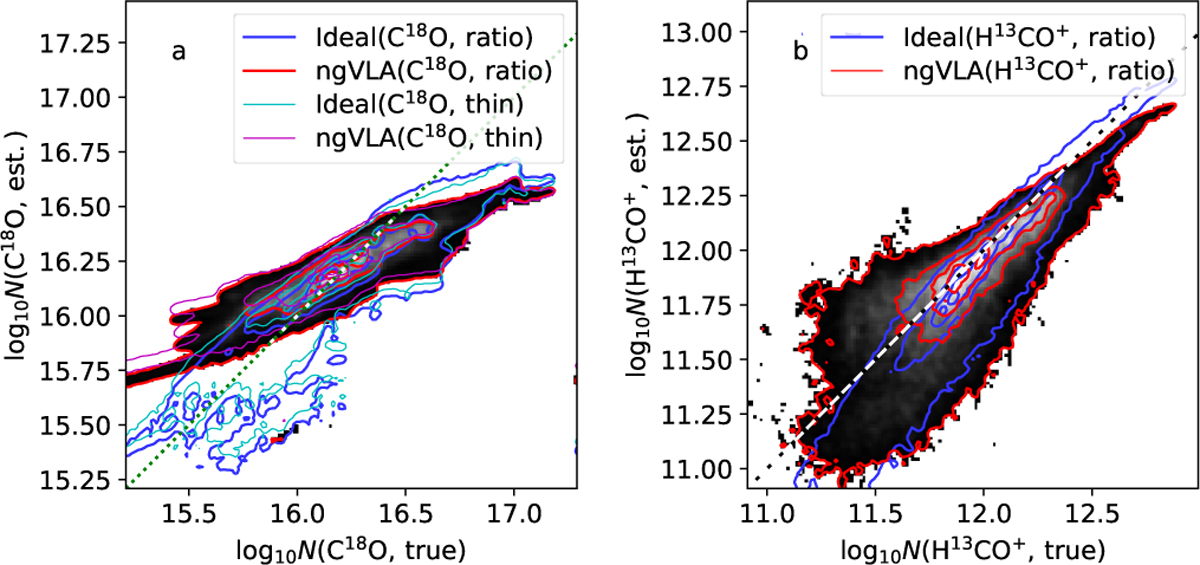
Column-density estimated from C18O versus 13CO (frame a) and H13CO+ versus HCO+ (frame b) line ratios, plotted against the true column density N′(H2) (accounting for the effect of density-dependent fractional abundances). Results are shown for both ideal observations and the combined ngVLA and single-dish data. The diagonal dashed line corresponds to the expected one-to-one relation. For each dataset (listed in the legends) there are four contour levels that are equidistant from close to zero up to 80% of the maximum point density. The background greyscale images correspond to the estimates calculated from ngVLA line ratios. In frame a, the estimates for optically thin C18O emission at Tex = 15 K are shown for comparison. Plots use data within 10″ of the pointing centres and a resolution of 0.7″.
Current usage metrics show cumulative count of Article Views (full-text article views including HTML views, PDF and ePub downloads, according to the available data) and Abstracts Views on Vision4Press platform.
Data correspond to usage on the plateform after 2015. The current usage metrics is available 48-96 hours after online publication and is updated daily on week days.
Initial download of the metrics may take a while.


