Open Access
Fig. 2
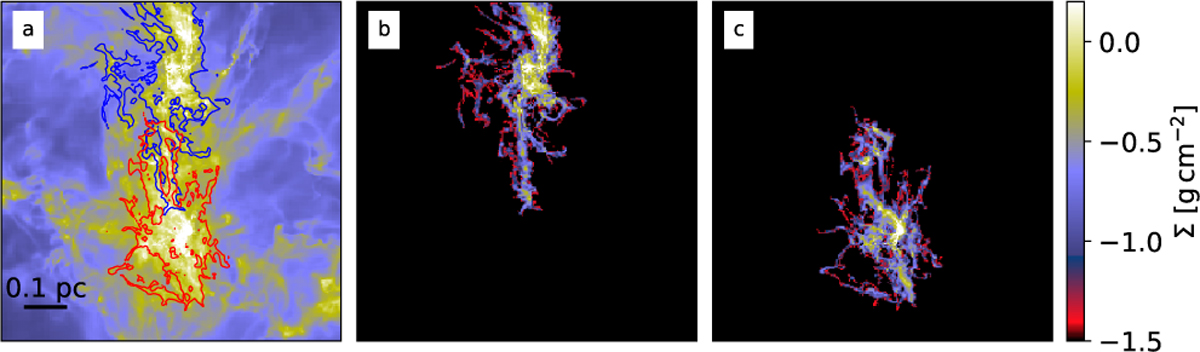
Download original image
Surface mass density of the whole model cloud (frame a) and separately for the northern and southern clumps (frames b and c). The clumps are defined using a density isosurface at 2 × 105 cm−3, and their outlines are also overplotted in frame a.
Current usage metrics show cumulative count of Article Views (full-text article views including HTML views, PDF and ePub downloads, according to the available data) and Abstracts Views on Vision4Press platform.
Data correspond to usage on the plateform after 2015. The current usage metrics is available 48-96 hours after online publication and is updated daily on week days.
Initial download of the metrics may take a while.