Fig. 19
Download original image
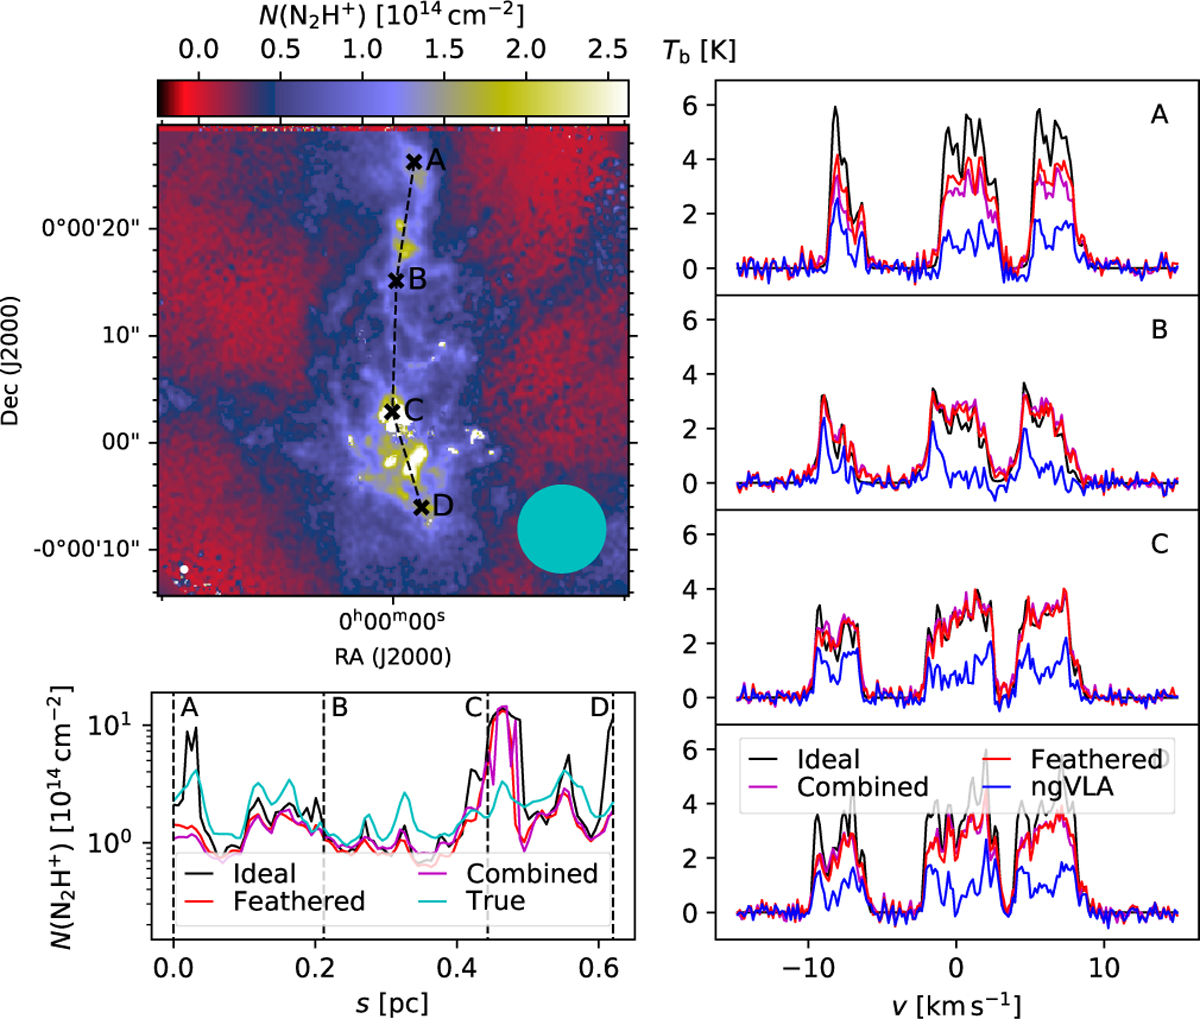
Comparison of N2H+ observations with and without single-dish data. The top left frame shows the N(N2H+) column-density map that is derived from the combined ngVLA and single-dish data. The circle in the lower left corner corresponds to the 0.55″ resolution of the final map, and the circle in the lower right corner shows the 8.1″ beam of the single-dish data. The bottom left frame shows a comparison of the column-density estimates along the path that is plotted in the first frame. Results are shown for ideal observations and for ngVLA and single-dish observations when both are included in the cleaning process (“combined”) or when they are joined afterwards through feathering (“feathered”). We plot also the true column density that is obtained directly from the model cube. The right-hαnd frames show sample spectra towards the four positions marked in the first frame. The spectra from interferometric observations without combined single-dish data (“ngVLA”) are also shown.
Current usage metrics show cumulative count of Article Views (full-text article views including HTML views, PDF and ePub downloads, according to the available data) and Abstracts Views on Vision4Press platform.
Data correspond to usage on the plateform after 2015. The current usage metrics is available 48-96 hours after online publication and is updated daily on week days.
Initial download of the metrics may take a while.