Fig. 18
Download original image
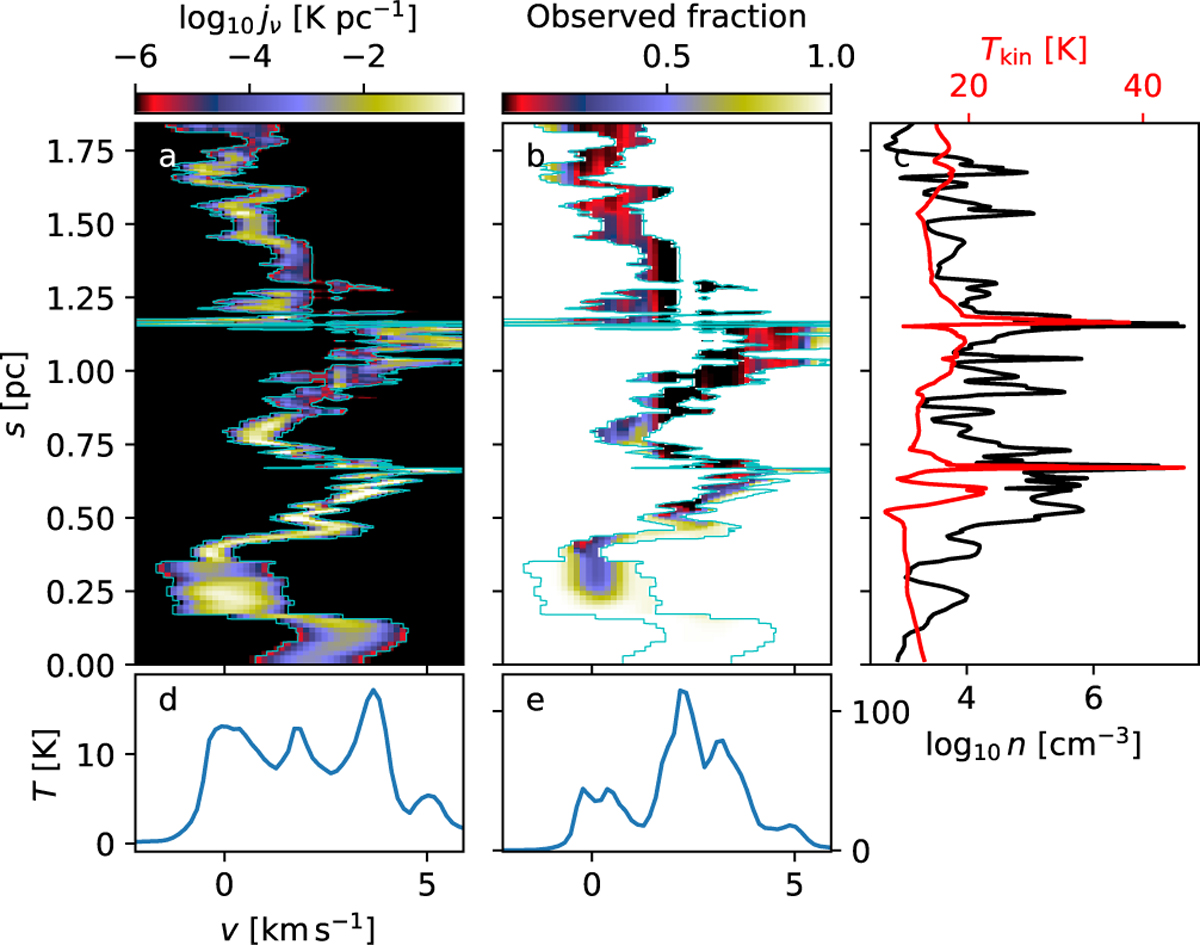
Contributions of different LOS regions to a selected HCO+(1−0) spectrum. In frames a and b, the y-axis corresponds to the distance from the observer’s side of the model cloud, and the x-axis shows the radial velocity. Frame a shows the intensity of the local emission that reaches the observer and thus contributes to the observed spectrum in frame d. Frame b shows the same as the fraction of the local emission that is not absorbed by the foregrounds. The cyan contours are drawn around significant emission, to help the comparison between the frames a and b. In frame b, the observed fraction of emission is plotted only inside the contour. Frame e shows the corresponding fictitious optically thin spectrum, where all foreground absorption is ignored. The LOS variations in density (black curve) and kinetic temperature (red curve) as shown in frame c.
Current usage metrics show cumulative count of Article Views (full-text article views including HTML views, PDF and ePub downloads, according to the available data) and Abstracts Views on Vision4Press platform.
Data correspond to usage on the plateform after 2015. The current usage metrics is available 48-96 hours after online publication and is updated daily on week days.
Initial download of the metrics may take a while.