Fig. 17
Download original image
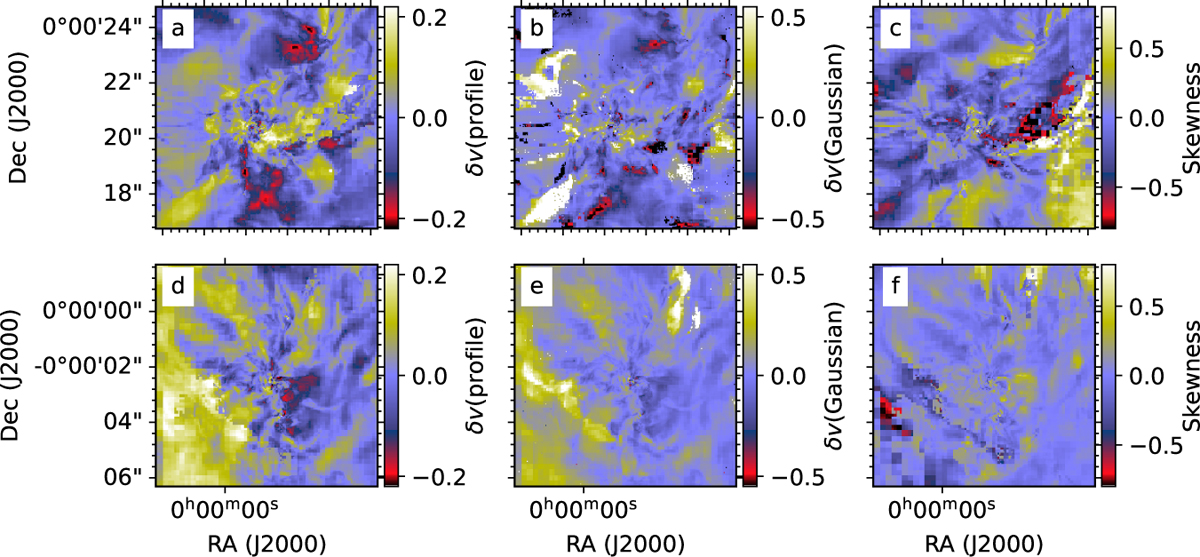
Collapse indicators δV based on ideal C18O and 13CO observations. The upper and lower frames show, respectively, the northern and the southern clumps, for the same area as in Fig. 16. Frames a and d show δυ(proflle) that is computed from channels around the peak of the C18O spectrum. Frames b and e show the corresponding δυ (Gaussian) that is based on line parameters from Gaussian fits. For comparison, frames c and f show the skewness of the 13CO line profiles.
Current usage metrics show cumulative count of Article Views (full-text article views including HTML views, PDF and ePub downloads, according to the available data) and Abstracts Views on Vision4Press platform.
Data correspond to usage on the plateform after 2015. The current usage metrics is available 48-96 hours after online publication and is updated daily on week days.
Initial download of the metrics may take a while.