Open Access
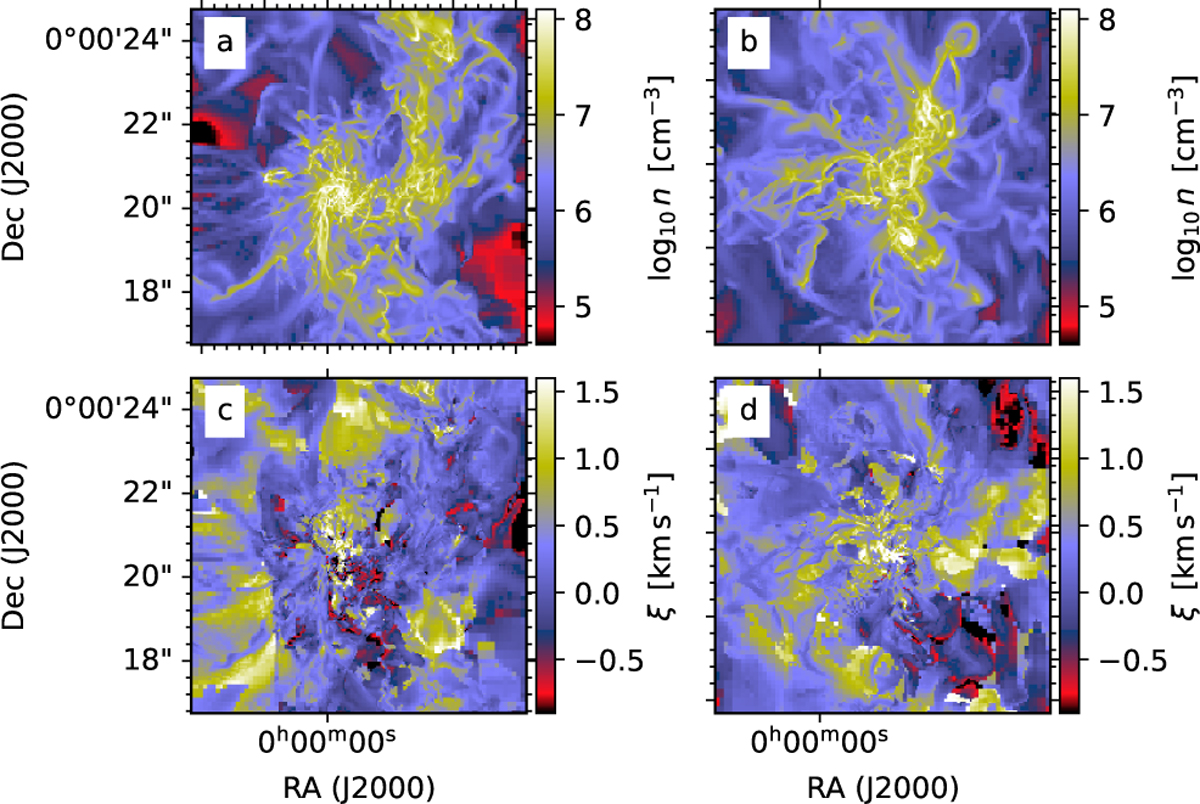
Fig. 16
Download original image
Maps of infall index ξ towards the cores. Upper frames show maps of the peak LOS density towards the northern (frame a) and the southern (frame b) core. The lower frames show the corresponding maps of the infall index ξ, which are computed using a threshold value of n0 = 104 cm−3.
Current usage metrics show cumulative count of Article Views (full-text article views including HTML views, PDF and ePub downloads, according to the available data) and Abstracts Views on Vision4Press platform.
Data correspond to usage on the plateform after 2015. The current usage metrics is available 48-96 hours after online publication and is updated daily on week days.
Initial download of the metrics may take a while.