Fig. 15
Download original image
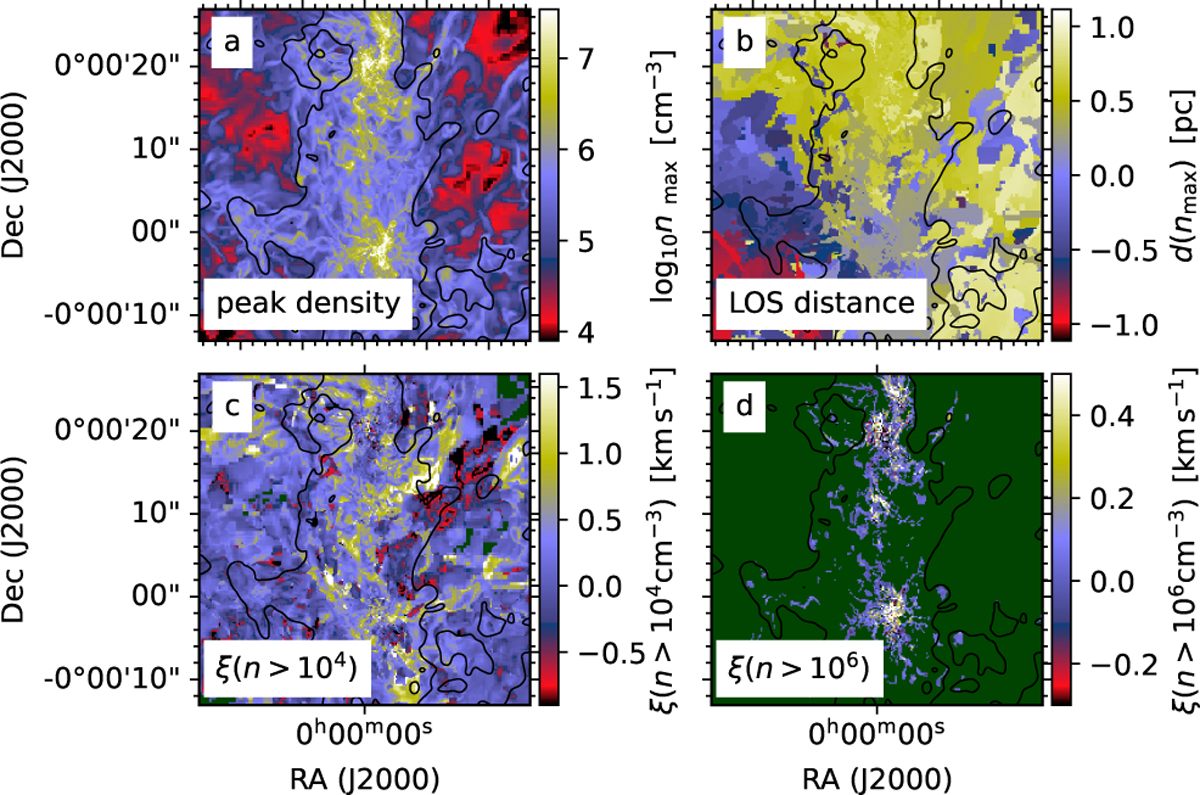
Maps of infall index ξ computed from the 3D model. Upper frames show the peak density along each LOS (frame a) and the distance (relative to the cloud centre) to that location along the LOS (frame b). The lower frames show the ξ maps for density thresholds n0 = 104 cm−3 and n0 = 106 cm−3. The dark green colour corresponds to masked areas where the maximum density along the LOS falls below the density threshold n0.
Current usage metrics show cumulative count of Article Views (full-text article views including HTML views, PDF and ePub downloads, according to the available data) and Abstracts Views on Vision4Press platform.
Data correspond to usage on the plateform after 2015. The current usage metrics is available 48-96 hours after online publication and is updated daily on week days.
Initial download of the metrics may take a while.