Fig. 1
Download original image
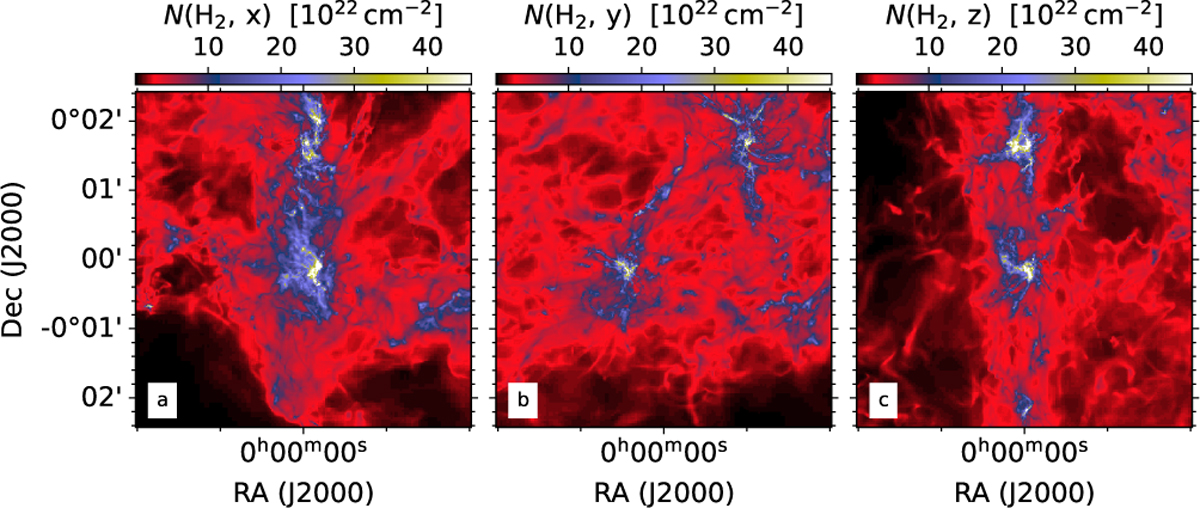
Column density of the selected cloud region viewed from three orthogonal directions. Frame a corresponds to the direction that is selected for the analysis of synthetic observations. The actual 3D spatial separation between the northern and southern density peaks is shown best in frame b (structures in the upper right and lower left part of the plot).
Current usage metrics show cumulative count of Article Views (full-text article views including HTML views, PDF and ePub downloads, according to the available data) and Abstracts Views on Vision4Press platform.
Data correspond to usage on the plateform after 2015. The current usage metrics is available 48-96 hours after online publication and is updated daily on week days.
Initial download of the metrics may take a while.