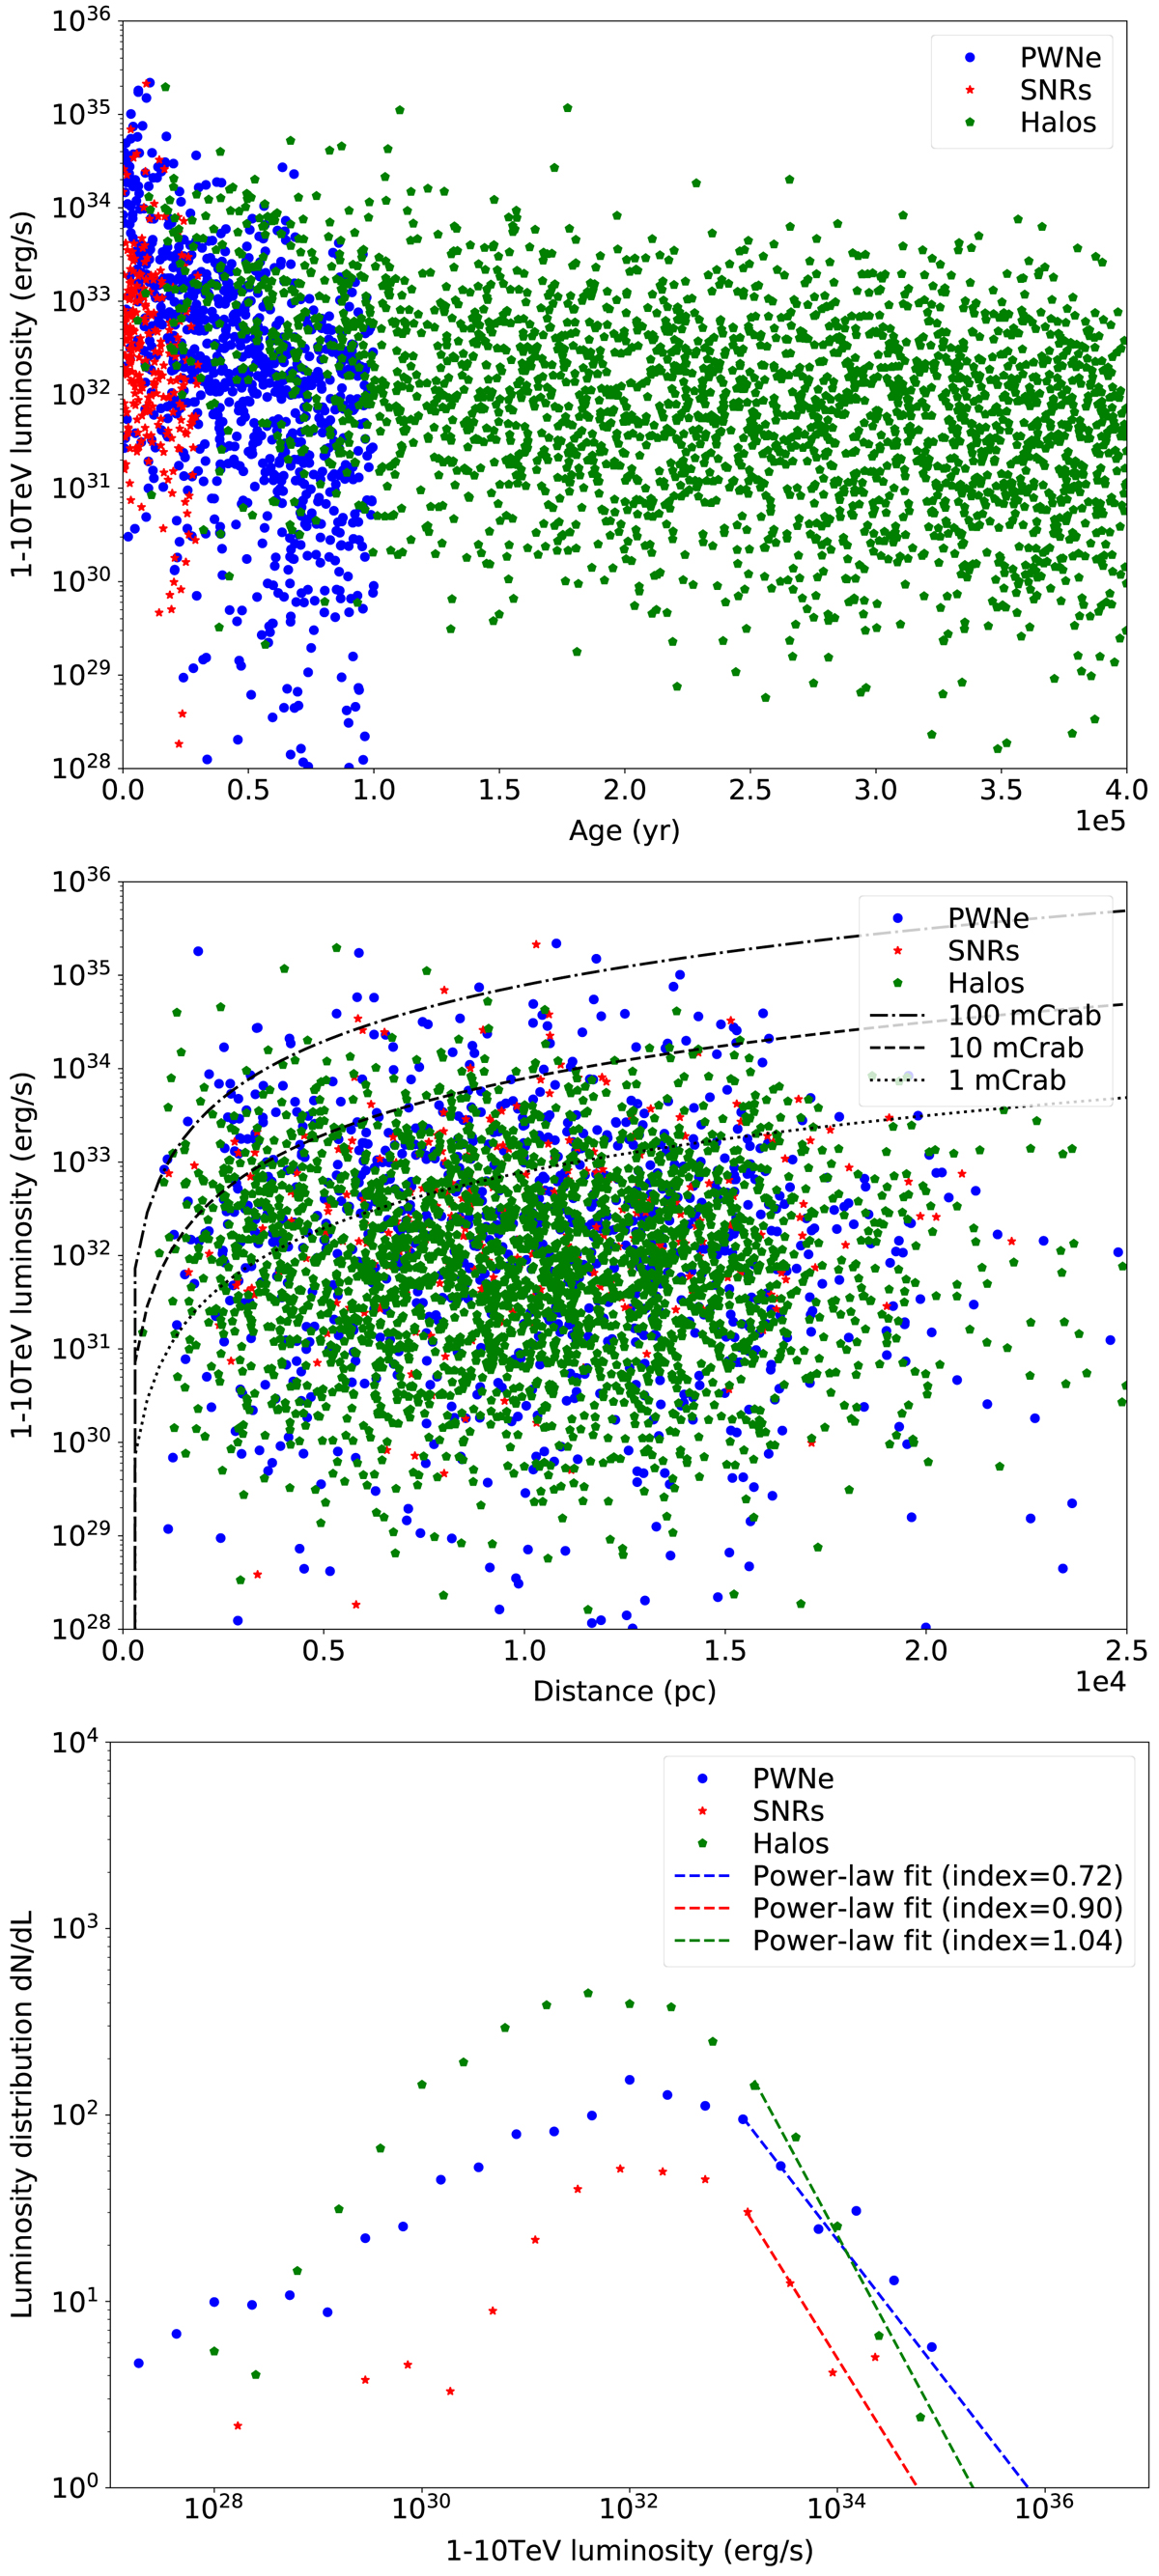
Fig. 4.
Download original image
Distribution of the 1 − 10 TeV luminosities for all classes of objects as a function of age, distance, and over the population. Overlaid in the middle panel for comparison are the luminosities corresponding to a 1, 10, or 100 mCrab flux. In the bottom panel, the dashed lines are power-law fits to the high-luminosity ends of the distributions.
Current usage metrics show cumulative count of Article Views (full-text article views including HTML views, PDF and ePub downloads, according to the available data) and Abstracts Views on Vision4Press platform.
Data correspond to usage on the plateform after 2015. The current usage metrics is available 48-96 hours after online publication and is updated daily on week days.
Initial download of the metrics may take a while.