| Issue |
A&A
Volume 666, October 2022
|
|
|---|---|---|
| Article Number | A190 | |
| Number of page(s) | 5 | |
| Section | Catalogs and data | |
| DOI | https://doi.org/10.1051/0004-6361/202243977 | |
| Published online | 28 October 2022 | |
Kharkiv database of asteroid absolute magnitudes: Comparative analysis with other datasets★
1
Department of Astronomy and Space Informatics of V. N. Karazin Kharkiv National University,
4 Svobody Sq.,
Kharkiv
61022, Ukraine
e-mail: This email address is being protected from spambots. You need JavaScript enabled to view it.
2
Institute of Astronomy of V. N. Karazin Kharkiv National University,
Sumska Street 35,
Kharkiv
61058, Ukraine
3
Astronomical Observatory Institute, Faculty of Physics, A. Mickiewicz University,
Sloneczna 36,
60-286
Poznan, Poland
4
Finnish Geospatial Research Institute FGI,
Vuorimiehentie 5,
02150
Espoo, Finland
5
Department of Physics,
PO box 64,
00014 University of Helsinki, Finland
Received:
8
May
2022
Accepted:
12
September
2022
Abstract
We present a database of the absolute magnitudes of asteroids named the Kharkiv Asteroid Absolute Magnitude Database (KhAAMD). The database includes a homogeneous set of the absolute magnitudes for about 400 asteroids in the new HG1G2 magnitude system. We performed a comparative analysis of the asteroid absolute magnitudes between the Kharkiv database and other main magnitude databases (MPC, Pan-STARRS, ATLAS, PTF, and Gaia). We show that the Pan-STARRS absolute magnitude dataset has no systematic deviations and is the most suitable for the determination of diameters and albedos of asteroids. For the MPC dataset, there is a linear trend of overestimating the absolute magnitudes of bright objects and underestimating the magnitudes of faint asteroids. The ATLAS dataset has both a systematic overestimation of asteroid magnitudes and a linear trend. We propose equations that can be used to correct for systematic errors in the MPC and the ATLAS magnitude datasets. There are possible systematic deviations of about 0.1 mag for the Gaia and PTF databases but there are insufficient data overlapping with our data for a definitive analysis.
Key words: minor planets / asteroids: general / methods: observational / techniques: photometric
The catalogue is only available at the CDS via anonymous ftp to cdsarc.u-strasbg.fr (130.79.128.5) or via http://cdsarc.u-strasbg.fr/viz-bin/cat/J/A+A/666/A190
© V. G. Shevchenko et al. 2022
 Open Access article, published by EDP Sciences, under the terms of the Creative Commons Attribution License (https://creativecommons.org/licenses/by/4.0), which permits unrestricted use, distribution, and reproduction in any medium, provided the original work is properly cited.
This article is published in open access under the Subscribe-to-Open model. This email address is being protected from spambots. You need JavaScript enabled to view it. to support open access publication.
1 Introduction
The main asteroid belt is a product of complex dynamic evolution, and its structure and the distribution of taxonomic types allow one to constrain or test models of the early history of the Solar System (Klahr et al. 2022; Raymond & Nesvorny 2022) and planetary migration scenarios (Walsh et al. 2011). Together with the size, the albedo refers to the main physical properties of asteroids. In addition to its independent significance, the albedo is also necessary for a robust taxonomic classification of asteroids. A mass method for determining the albedo of asteroids based on the radiometric measurements of their thermal fluxes was proposed at the beginning of the 1970s (Allen 1970; Matson 1971). Thermal IR (infrared) fluxes are used to derive effective spherical diameters of asteroids and, in combination with reflected visual fluxes, to derive albedos. Since real asteroids have more complicated shapes, their reflected visual fluxes can change due to rotation. Ideally, both the integral thermally emitted infrared and the integral reflected visual fluxes should be measured simultaneously. But in most cases the thermal observations are carried out separately (Mainzer et al. 2015) and integral reflected visual flux is calculated from the asteroid's absolute visual magnitude H.
The absolute magnitude is one of the main characteristics of asteroids obtained from photometric observations. It is defined as a magnitude reduced to unit distances from the Sun and the observer of a spherical body, observed at zero solar phase angle, that has the same brightness as the rotationally averaged brightness of a given asteroid, observed in the same geometry. In most cases, the absolute magnitude H is given as a brightness in the Johnson V band. The accuracy of absolute magnitudes is determined not only by the accuracy of photometry but also by the choice of the function, which fits and extrapolates the measured magnitudes down to zero phase angle. Accurate determination of H is crucial for size and albedo estimations of remotely observed objects. If sizes are usually determined up to 10%, but albedos have much larger uncertainties in determination (Harris & Harris 1997). In addition, Masiero et al. (2021) urged caution when attempting to derive the physical properties of asteroids only from albedos.
At present, the main database of asteroid absolute magnitudes is the database compiled by the Minor Planet Center (MPC). The MPC receives asteroid magnitudes from many observatories and observation stations measured in different spectral bands of different photometric systems. It calculates absolute magnitudes for the V band of the Johnson photometric system using the HG-function (Bowell et al. 1989) with a constant value of G parameter (0.15) for the majority of asteroids. Therefore, the MPC magnitudes can have various systematic and random errors. A comparison of the MPC absolute magnitudes (HMPC) with the dataset of high-quality absolute magnitudes obtained by Pravec et al. (2012) has revealed systematic differences between these datasets. To account for these systematic differences, several attempts were made to revise albedos from the WISE (Pravec et al. 2012) and AKARI databases (Ali-Lagoa et al. 2018). The new HG1G2 function was proposed by Muinonen et al. (2010) to be used for more precise estimates of asteroid absolute magnitudes. This function was calibrated according to high-quality magnitude-phase curves, and the average parameters for the main taxonomic classes of asteroids were obtained (Penttilä et al. 2016; Shevchenko et al. 2016; Oszkiewicz et al. 2021). Using the average parameter values, it was made possible to calculate the absolute magnitudes of asteroids from only a few individual observations obtained at different phase angles. For sparse photometric data, using the two-parameter  version of the system (Muinonen et al. 2010; Oszkiewicz et al. 2011; Penttilä et al. 2016) was suggested.
Recently, thanks to large-scale survey programmes, such as Pan-STARRS, Palomar Transient Factory (PTF) and ATLAS (Veres et al. 2015; Waszczak et al. 2015; Mahlke et al. 2021) new datasets of asteroid absolute magnitudes have been derived. In addition, the data on the absolute magnitudes of asteroids were obtained from observations of the Gaia satellite (Colazo et al. 2021; Martikainen et al. 2021; Wilawer et al. 2022), which need to be reduced to the standard V band. In addition, the data from some photometric surveys were reworked to obtain a set of asteroid absolute magnitudes (e.g. Alvarez-Candal et al. 2022). The abovementioned datasets are homogeneous, but they were typically obtained in different photometric systems and then transformed to the Johnson system. Comparison of the absolute magnitudes from these datasets with the MPC data showed some systematic deviations (Vereš et al. 2015; Waszczak et al. 2015). It should be noted that the absolute magnitudes of asteroids from the Pan-STARRS and PTF surveys (Vereš et al. 2015; Waszczak et al. 2015) were obtained using the new  system. To check the reliability of these and other datasets and to identify systematic deviations, an independent high-quality dataset on asteroid absolute magnitudes is required. Here we present the homogeneous high-quality dataset on the absolute magnitudes of asteroids called the Kharkiv Asteroid Absolute Magnitude Database (KhAAMD) and compare the data with other available databases.
2 Kharkiv asteroid absolute magnitude database
For our dataset of absolute magnitudes, we used data collected at the Institute of Astronomy of V. N. Karazin Kharkiv National University within the long-term observational programme to study asteroid magnitude-phase curves (Shevchenko et al. 2010, 2012, 2014a, 2016; Slyusarev et al. 2012). We also used some observational data obtained within several other programmes (Belskaya et al. 2010; Chiorny et al. 2007, 2011; Dotto et al. 2009; Hahn et al. 1989; Kaasalainen et al. 2004; Lagerkvist et al. 1998; Michalowski et al. 1995; Mohamed et al. 1994, 1995; Oszkiewicz et al. 2021; Shevchenko et al. 1992, 2003, 2009, 2014b, 2021; Velichko et al. 1995; Wilawer et al. 2022). All magnitudes were measured in the Johnson V band and extrapolated to zero phase angle using the HG1G2 system proposed by Muinonen et al. (2010), with some modifications presented by Penttilä et al. (2016). For computations, the online calculator1 for the HG1G2 photometric system was used. Since we derived absolute magnitudes in our data from the light curve maxima, and the definition of H is based on the rotationally averaged brightness, we added a half of the light curve amplitude corrected to zero phase angle to our results. We used the average correction coefficients from Zappala et al. (1990) for low- and moderate-albedo asteroids. This correction is typically very small because our light curve observations covered small phase angles. Absolute magnitudes obtained at different aspects were averaged. In such a manner, we obtained a homogeneous dataset of absolute magnitudes of about 400 asteroids up to H = 16.5 mag. Our database includes the absolute magnitude data, the G1 and G2 parameters, and the albedo and diameter values from different databases (such as Tedesco et al. 2002; Masiero et al. 2011, 2012; Nugent et al. 2015; Usui et al. 2011). The database is available at the CDS. Figure 1 shows the correlations of the absolute magnitudes from the largest datasets (MPC (HMPC), Pan-STARRS (HPS), and ATLAS (HATLAS)) with those of the Kharkiv dataset (HKH). For the ATLAS dataset, we used the absolute magnitudes in a cyan filter, since this filter overlaps the Johnson V band (Mahlke et al. 2021).
The linear fit coefficients between our magnitude estimates and values from other databases are presented in Table 1. As one can see, there is a strong linear correlation between our values and the other three largest datasets. There are small differences in the constant terms and slopes that point out some systematic deviations. In the next section, we discuss the available datasets of asteroid absolute magnitudes in more detail.
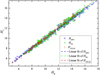 |
Fig. 1 Correlations of absolute magnitudes from datasets of HMPC, HPS, and HATLAS with HKH. |
Coefficients of linear fits of different magnitude sets with the Kharkiv dataset.
3 Discussion
3.1 MPC dataset
A histogram of the deviations of the MPC dataset from the Kharkiv dataset is presented in Fig. 2 (the solid line is a fit to to the data using a normal distribution curve). The histogram does not show noticeable systematical deviations and about 88% of the deviations lie in the range from -0.35 to +0.35 mag.
In Fig. 3, the dependence of the magnitude deviations between the Kharkiv and MPC datasets versus the absolute magnitudes of the Kharkiv dataset is shown. There is a systematic overestimation of the absolute magnitudes for the bright objects and an underestimation for the faint ones with a linear trend. The linear trend is more evident after applying a moving-average filter to the data (the red dots in Fig. 3). We used five points in our moving average filter. The coefficients of linear regression are presented in Table 2. The trend can be explained by the lowquality of some magnitudes, especially for the faint objects, as well as by incorrect transformation of instrumental magnitudes to the standard Johnson system. Pravec et al. (2012) pointed out such deviations.
The obtained equation can be useful for transforming the MPC magnitude datasets. However, we note that the accuracy of the MPC data has improved compared to the previous analysis. According to Pravec et al. (2012), a mean deviation was about 0.5 mag for objects of 14 mag, whereas for our dataset, the mean deviation is about 0.3 mag for asteroids of the same magnitude. With the corrections presented in our work, the accuracy of the absolute magnitude of the MPC dataset can be further improved especially for faint objects.
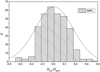 |
Fig. 2 Histogram of differences between HKH and HMPC. The solid line shows the normal distribution curve fitted to data. |
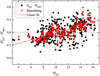 |
Fig. 3 Differences between HKH and HMPC. Red dots present values from the moving-average filter. |
Coefficients of linear fits of magnitude deviations.
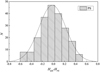 |
Fig. 4 Histogram of differences between HKH and HPS. The solid line shows the normal distribution curve. |
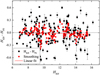 |
Fig. 5 Differences between HKH and Ηκ. |
3.2 Pan-STARRS dataset
The best agreement with our dataset was found in the Pan-STARRS dataset (Veres et al. 2015). This is confirmed by the histogram of absolute magnitude deviations presented in Fig. 4. The histogram does not show any systematical deviations -although the deviations are of the same order as for the MPC dataset, and about 86% of the deviations lie in the range from −0.35 to +0.35 mag.
There is a small linear trend after applying a moving-average filter to the PS data (Fig. 5). The coefficients of the linear regression are presented in Table 2. The deviations are small and comparable with the observational errors, but for faint asteroids (23–24 mag) they should be taken into account in the future. All this points out a high-quality reduction of the instrumental magnitudes to the V magnitudes of the Johnson photometric system in the Pan-STARRS dataset for magnitudes less than 23.
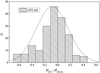 |
Fig. 6 Histogram of differences between HKH and HATLAS. Again, solid line is normal distribution curve. |
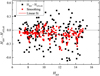 |
Fig. 7 Differences between HKH and HATLAS (red dots are from the moving-average filter). |
3.3 ATLAS dataset
The database of the ATLAS absolute magnitudes is presented in two filters: cyan and orange (Mahlke et al. 2021). For an analysis of this database, we used the absolute magnitudes in a cyan filter, since this broadband filter is centred close to a centre of the Johnson V band and overlaps it. A histogram of the deviations of the ATLAS dataset from the Kharkiv dataset is presented in Fig. 6. The histogram shows systematic deviations of about –0.1 mag. Overall deviations range between about –0.7 to +0.45 mag. Despite the systematic deviations, about 85% of the deviations lie in range from –0.35 to +0.35 mag.
In Fig. 7, we show the dependence of the magnitude deviations between the Kharkiv and ATLAS datasets as a function of the Kharkiv dataset magnitude. As seen from the figure, there are both a systematic underestimation of the asteroid magnitudes and a linear trend (as in the case for the MPC magnitudes). The trend is more visible after data averaging using a moving-average filter (the red dots in Fig. 7). The coefficients of the linear regression are presented in Table 2. When using this dataset in the V band in future, it is necessary to carry out a correction of the magnitudes with the obtained regression equation.
3.4 PTFand Gaia datasets
We also considered the PTF magnitude dataset (Waszczak et al. 2015), but there is a lack of overlapping data (the overlap is only about twenty objects) for a detailed statistical analysis. With the data available, we found a possible existence of a systematic deviation of about 0.1 mag in comparison to our data.
Colazo et al. (2021) combined the averaged photometric measurements of asteroids obtained in Gaia DR2 (Gaia Collaboration 2018) with ground-based relative photometry in the V band from the photometric catalogue of light curves (Lagerkvist et al. 1995). In total, the authors obtained absolute magnitudes for 9817 asteroids. Comparing this dataset with our dataset, we found only about 40 asteroids included in both datasets. Figure 8 shows the relationship between the deviations of the absolute magnitudes between these two datasets relative to the absolute magnitudes of the Kharkiv dataset (dark squares). For comparison, we plot also the deviations for the PanSTARRS dataset (Veres et al. 2015), currently the best-quality dataset of the absolute magnitudes of asteroids (open circles). As one can see from the figure, we have slightly larger variations for the Gaia data compared to the PanSTARRS data. In addition, some systematic deviations among the Gaia data (not more than 0.1 mag) can exist, but the sample is too small and does not cover faint asteroids. We plan to expand our dataset and to include as many objects as possible from the Gaia database.
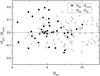 |
Fig. 8 Differences between HKH and HGAIA. |
4 Conclusions
We present a dataset of the absolute magnitudes of asteroids obtained at the Institute of Astronomy of V. N. Karazin Kharkiv National University that is a part of general database named the Kharkiv Asteroid Absolute Magnitude Database (KhAAMD). Currently, the dataset includes a homogeneous set of the absolute magnitudes for about 400 asteroids but the number of objects is constantly increasing. The absolute magnitudes were obtained using the new HG1G2 system of magnitudes and considering light curve variations. The range of magnitudes lie from 3.5 to 16.5 mag. We made a comparative analysis of the asteroid absolute magnitudes of our dataset with other magnitude databases (MPC, Pan-STARRS, ATLAS, PTF, and Gaia). All databases show rather good agreement but for some of them there are systematic differences. We demonstrated that the absolute magnitude dataset obtained from the Pan-STARRS survey is the closest one to the Kharkiv dataset, has no systematic deviations, and has a very small trend for faint objects. The absolute magnitudes from the Pan-STARRS database are the most suitable ones for determining diameters or geometric albedos of asteroids based on the absolute magnitudes.
The MPC dataset has a linear trend of overestimating magnitudes of bright objects and underestimating those of faint ones. We proposed an equation for correcting the MPC magnitude dataset that can improve the usage of the MPC absolute magnitudes.
For the ATLAS cyan dataset, there are both a systematic overestimation of asteroid magnitudes and a linear trend. It is necessary to do a correction with the obtained equation to correctly use this dataset for the V band in the future.
For the other datasets, the overlap with our dataset is insufficient for a detailed statistical analysis. We only note a possible existence of a systematic deviation of about 0.1 mag of the Gala and PTF datasets from our data.
Acknowledgements
This work has made use of data and/or services provided by the International Astronomical Union's Minor Planet Centre and of NASA's Astrophysics Data System. This research was partially funded by the National Research Foundation of Ukraine, project N2020.02/0371 "Metallic asteroids: search for parent bodies of iron meteorites, sources of extraterrestrial resources" and the Academy of Finland grants No. 325806, 336546 and 345115. D.O. was supported by grant number 2017/26/D/ST9/00240 from the National Science Centre, Poland. T.K. was supported by grant number 2017/25/B/ST9/00740 from the National Science Centre, Poland. V.S. thanks EUROPLANET support for local visits in Ukraine. We are grateful to the anonymous reviewer for constructive comments that improved our article. We are grateful to all the defenders of Ukraine from the Russian invasion so that we can safely finalise this article.
References
- Alí-Lagoa, V., Müller, T. G., Usui, F., & Hasegawa, S. 2018, A&A, 612, A85 [NASA ADS] [CrossRef] [EDP Sciences] [Google Scholar]
- Allen, D. A. 1970, Nature, 227, 158 [NASA ADS] [CrossRef] [Google Scholar]
- Alvarez-Candal, A., Benavidez, P. G., Campo Bagatin, A., & Santana-Ros, T. 2022, A&A, 657, A80 [NASA ADS] [CrossRef] [EDP Sciences] [Google Scholar]
- Belskaya, I. N., Fornasier, S., Krugly, Y. N., et al. 2010, A&A, 515, A29 [NASA ADS] [CrossRef] [EDP Sciences] [Google Scholar]
- Bowell, E., Hapke, B., Domingue, D., et al. 1989, in Asteroids II, eds. R. P. Binzel, T. Gehrels, & M. S. Matthews (Tucson: University of Arizona Press), 524 [Google Scholar]
- Chiorny, V. G., Shevchenko, V. G., Krugly, Y. N., Velichko, F. P., & Gaftonyuk, N. M. 2007, Planet. Space Sci., 55, 986 [CrossRef] [Google Scholar]
- Chiorny, V., Galád, A., Pravec, P., et al. 2011, Planet. Space Sci., 59, 1482 [CrossRef] [Google Scholar]
- Colazo, M., Duffard, R., & Weidmann, W. 2021, MNRAS, 504, 761 [NASA ADS] [CrossRef] [Google Scholar]
- Dotto, E., Perna, D., Fornasier, S., et al. 2009, A&A, 494, L29 [NASA ADS] [CrossRef] [EDP Sciences] [Google Scholar]
- Gaia Collaboration (Spoto, F., et al.) 2018, A&A, 616, A13 [NASA ADS] [CrossRef] [EDP Sciences] [Google Scholar]
- Hahn, G., Magnusson, P., Harris, A. W., et al. 1989, Icarus, 78, 363 [NASA ADS] [CrossRef] [Google Scholar]
- Harris, A. W., & Harris, A. W. 1997, Icarus, 126, 450 [Google Scholar]
- Kaasalainen, M., Pravec, P., Krugly, Y. N., et al. 2004, Icarus, 167, 178 [NASA ADS] [CrossRef] [Google Scholar]
- Klahr, H., Delbo, M., & Gerbig, K. 2022, in Vesta and Ceres. Insights from the Dawn Mission for the Origin of the Solar System (Cambridge: Cambridge University Press), 199 [Google Scholar]
- Lagerkvist, C. I., Magnusson, I., Belskaya, A., et al. 1995, NASA Planetary Data System, EAR (USA: NASA) [Google Scholar]
- Lagerkvist, C. I., Belskaya, I., Erikson, A., et al. 1998, A&AS, 131, 55 [NASA ADS] [CrossRef] [EDP Sciences] [Google Scholar]
- Mahlke, M., Carry, B., & Denneau, L. 2021, Icarus, 354, 114094 [Google Scholar]
- Mainzer, A., Usui, F., & Trilling, D. E. 2015, in Asteroids IV (Tucson: University of Arizona Press), 89 [Google Scholar]
- Martikainen, J., Muinonen, K., Penttilä, A., Cellino, A., & Wang, X. B. 2021, A&A, 649, A98 [NASA ADS] [CrossRef] [EDP Sciences] [Google Scholar]
- Masiero, J. R., Mainzer, A. K., Grav, T., et al. 2011, ApJ, 741, 68 [Google Scholar]
- Masiero, J. R., Mainzer, A. K., Grav, T., Bauer, J. M., & Jedicke, R. 2012, ApJ, 759, 14 [NASA ADS] [CrossRef] [Google Scholar]
- Masiero, J. R., Wright, E. L., & Mainzer, A. K. 2021, Planeta. Sci. J., 2, 32 [NASA ADS] [CrossRef] [Google Scholar]
- Matson, D. L. 1971, in Asteroids (USA: NASA Special Publication), ed. T. Gehrels, 267, 45 [NASA ADS] [Google Scholar]
- Michalowski, T., Velichko, F. P., Di Martino, M., et al. 1995, Icarus, 118, 292 [NASA ADS] [CrossRef] [Google Scholar]
- Mohamed, R. A., Chiorny, V. G., Dovgopol, A. N., & Shevchenko, V. G. 1994, A&AS, 108, 69 [NASA ADS] [Google Scholar]
- Mohamed, R. A., Krugly, Y. N., & Lupishko, D. F. 1995, AJ, 109, 1877 [NASA ADS] [CrossRef] [Google Scholar]
- Muinonen, K., Belskaya, I. N., Cellino, A., et al. 2010, Icarus, 209, 542 [Google Scholar]
- Nugent, C. R., Mainzer, A., Masiero, J., et al. 2015, ApJ, 814, 117 [NASA ADS] [CrossRef] [Google Scholar]
- Oszkiewicz, D., Muinonen, K., Bowell, E., et al. 2011, J. Quant. Spectr. Rad. Trans., 112, 1919 [NASA ADS] [CrossRef] [Google Scholar]
- Oszkiewicz, D., Wilawer, E., Podlewska-Gaca, E., et al. 2021, Icarus, 357, 114158 [NASA ADS] [CrossRef] [Google Scholar]
- Penttilä, A., Shevchenko, V. G., Wilkman, O., & Muinonen, K. 2016, Planet. Space Sci., 123, 117 [Google Scholar]
- Pravec, P., Harris, A. W., Kušnirák, P., Galád, A., & Hornoch, K. 2012, Icarus, 221, 365 [NASA ADS] [CrossRef] [Google Scholar]
- Raymond, S. N., & Nesvorný, D. 2022, in Vesta and Ceres. Insights from the Dawn Mission for the Origin of the Solar System (Cambridge: Cambridge University Press), 227 [Google Scholar]
- Shevchenko, V. G., Chernyi, V. G., Kruglyi, I. N., et al. 1992, Icarus, 100, 295 [NASA ADS] [CrossRef] [Google Scholar]
- Shevchenko, V. G., Krugly, Y. N., Chiorny, V. G., Belskaya, I. N., & Gaftonyuk, N. M. 2003, Planet. Space Sci., 51, 525 [CrossRef] [Google Scholar]
- Shevchenko, V. G., Tungalag, N., Chiorny, V. G., et al. 2009, Planet. Space Sci., 57, 1514 [CrossRef] [Google Scholar]
- Shevchenko, V. G., Belskaya, I. N., Lupishko, D. F., et al. 2010, NASA Planetary Data System (USA: NASA), 134 [Google Scholar]
- Shevchenko, V. G., Belskaya, I. N., Slyusarev, I. G., et al. 2012, Icarus, 217, 202 [NASA ADS] [CrossRef] [Google Scholar]
- Shevchenko, V. G., Slyusarev, I. G., & Belskaya, I. N. 2014a, Meteor. Planet. Sci., 49, 103 [NASA ADS] [CrossRef] [Google Scholar]
- Shevchenko, V. G., Velichko, F. P., Checha, V. A., & Krugly, Y. N. 2014b, Minor Planet Bull., 41, 195 [NASA ADS] [Google Scholar]
- Shevchenko, V. G., Belskaya, I. N., Muinonen, K., et al. 2016, Planet. Space Sci., 123, 101 [Google Scholar]
- Shevchenko, V. G., Mikhalchenko, O. I., Belskaya, I. N., et al. 2021, Planet. Space Sci., 202, 105248 [NASA ADS] [CrossRef] [Google Scholar]
- Slyusarev, I. G., Shevchenko, V. G., Belskaya, I. N., Krugly, Y. N., & Chiorny, V. G. 2012, Lunar Planet. Sci Conf, 43, 1885 [Google Scholar]
- Tedesco, E. F., Noah, P. V., Noah, M., & Price, S. D. 2002, AJ, 123, 1056 [Google Scholar]
- Usui, F., Kuroda, D., Müller, T. G., et al. 2011, PASJ, 63, 1117 [Google Scholar]
- Velichko, F. P., Michalowski, T., Erikson, A., et al. 1995, A&AS, 110, 125 [Google Scholar]
- Vereš, P., Jedicke, R., Fitzsimmons, A., et al. 2015, Icarus, 261, 34 [CrossRef] [Google Scholar]
- Walsh, K. J., Morbidelli, A., Raymond, S. N., O’Brien, D. P., & Mandell, A. M. 2011, Nature, 475, 206 [Google Scholar]
- Waszczak, A., Chang, C.-K., Ofek, E. O., et al. 2015, AJ, 150, 75 [NASA ADS] [CrossRef] [Google Scholar]
- Wilawer, E., Oszkiewicz, D., Kryszczyńska, A., et al. 2022, MNRAS, 513, 3242 [NASA ADS] [CrossRef] [Google Scholar]
- Zappala, V., Cellino, A., Barucci, A. M., Fulchignoni, M., & Lupishko, D. F. 1990, A&A, 231, 548 [NASA ADS] [Google Scholar]
Online calculator for the HG1G2 photometric system is available at http://h152.it.helsinki.fi/HG1G2/
All Tables
Coefficients of linear fits of different magnitude sets with the Kharkiv dataset.
All Figures
|
Fig. 1 Correlations of absolute magnitudes from datasets of HMPC, HPS, and HATLAS with HKH. |
| In the text | |
|
Fig. 2 Histogram of differences between HKH and HMPC. The solid line shows the normal distribution curve fitted to data. |
| In the text | |
|
Fig. 3 Differences between HKH and HMPC. Red dots present values from the moving-average filter. |
| In the text | |
|
Fig. 4 Histogram of differences between HKH and HPS. The solid line shows the normal distribution curve. |
| In the text | |
|
Fig. 5 Differences between HKH and Ηκ. |
| In the text | |
|
Fig. 6 Histogram of differences between HKH and HATLAS. Again, solid line is normal distribution curve. |
| In the text | |
|
Fig. 7 Differences between HKH and HATLAS (red dots are from the moving-average filter). |
| In the text | |
|
Fig. 8 Differences between HKH and HGAIA. |
| In the text | |
Current usage metrics show cumulative count of Article Views (full-text article views including HTML views, PDF and ePub downloads, according to the available data) and Abstracts Views on Vision4Press platform.
Data correspond to usage on the plateform after 2015. The current usage metrics is available 48-96 hours after online publication and is updated daily on week days.
Initial download of the metrics may take a while.