Fig. 8
Download original image
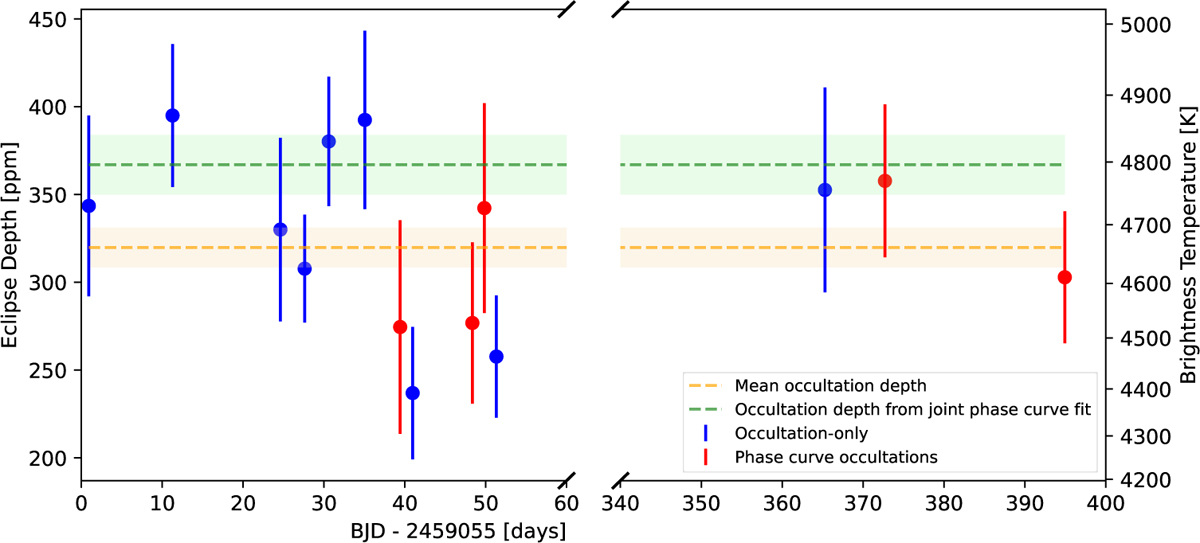
Fitted eclipse depths from the 9 CHEOPS occultation observations (in blue) and 5 CHEOPS occultations extracted from the phase curves (in red). The eclipse depth derived from the joint CHEOPS phase curve fit is shown in green (367 ± 17 ppm, with 1σ shaded) and the mean value of these 14 occultations (320 ± 11 ppm) is shown in orange (with 1σ shaded). These two mean eclipse depths are consistent with each other by just over 2σ. The right-hand y-axis shows how the eclipse depths convert to dayside brightness temperatures, assuming the dayside hemisphere is a blackbody and radiates at a uniform temperature.
Current usage metrics show cumulative count of Article Views (full-text article views including HTML views, PDF and ePub downloads, according to the available data) and Abstracts Views on Vision4Press platform.
Data correspond to usage on the plateform after 2015. The current usage metrics is available 48-96 hours after online publication and is updated daily on week days.
Initial download of the metrics may take a while.