Fig. 1
Download original image
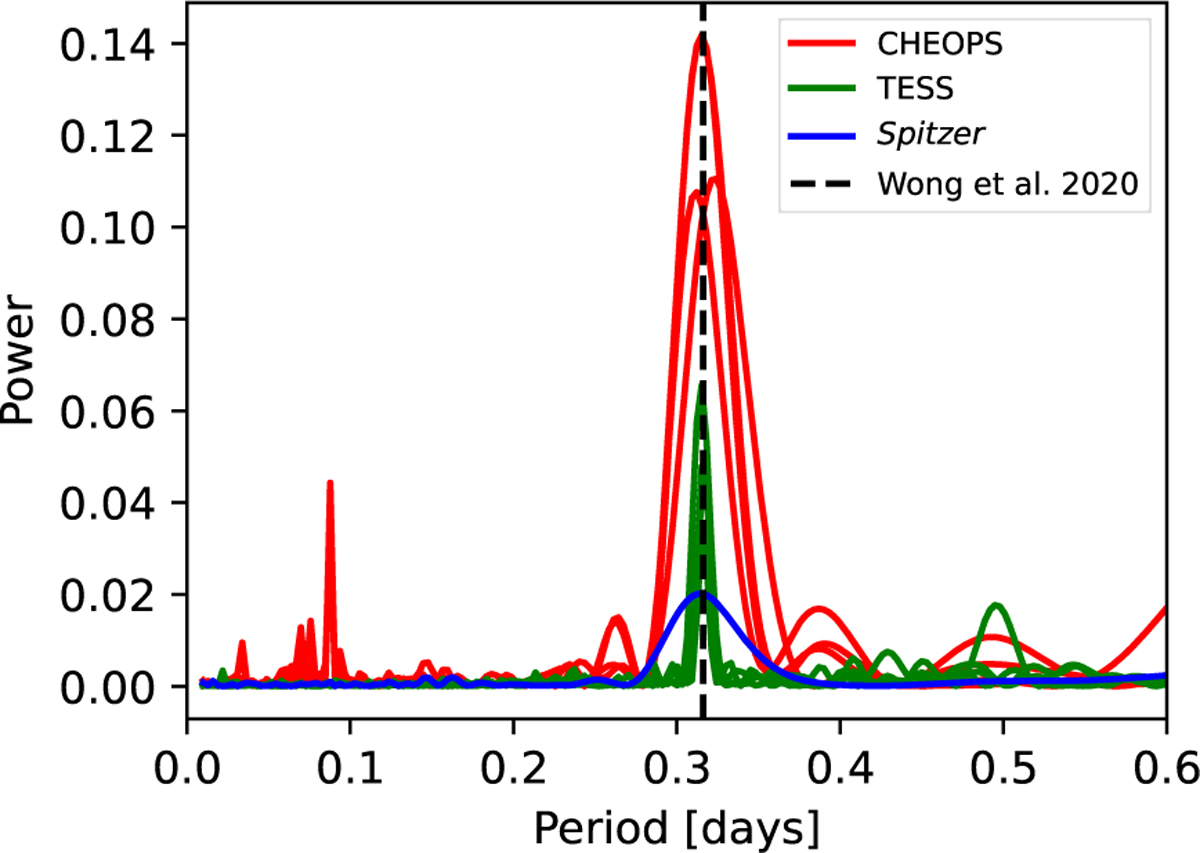
Periodograms reveal the presence of stellar pulsations in the residuals of the phase curve fitting. In red are the four CHEOPS phase curves, in green are the TESS phase curves and in blue is the Spitzer phase curve. It is clear the stellar pulsation period (near 0.3 days) is present in all phase curves and matches that signal seen also in Wong et al. (2020) and Mansfield et al. (2020) (dashed black line). The short period peaks are only present in CHEOPS but not TESS or Spitzer so we assume they are CHEOPS systematics and disregard the signal.
Current usage metrics show cumulative count of Article Views (full-text article views including HTML views, PDF and ePub downloads, according to the available data) and Abstracts Views on Vision4Press platform.
Data correspond to usage on the plateform after 2015. The current usage metrics is available 48-96 hours after online publication and is updated daily on week days.
Initial download of the metrics may take a while.