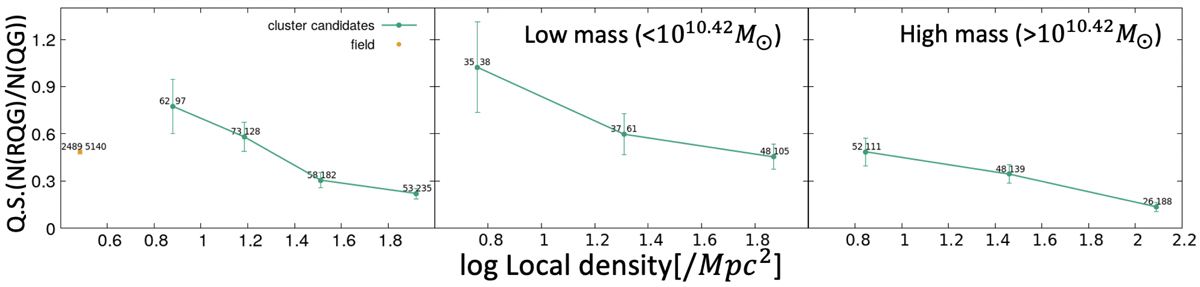
Fig. 8.
Download original image
Environmental dependence of Q.S. Left panel: dependence for all environments. Middle and right panels: dependence in different mass bins (same bin division as in Fig. 6). The number to the left of each data point is the number of RQGs in this density bin, while the number to the right is the number of QGs. The total number of QGs or RQGs in the middle and the right panels is the same as the number of cluster candidates in the left panel. Errors are propagated based on the Poisson statistics for each population in each bin.
Current usage metrics show cumulative count of Article Views (full-text article views including HTML views, PDF and ePub downloads, according to the available data) and Abstracts Views on Vision4Press platform.
Data correspond to usage on the plateform after 2015. The current usage metrics is available 48-96 hours after online publication and is updated daily on week days.
Initial download of the metrics may take a while.