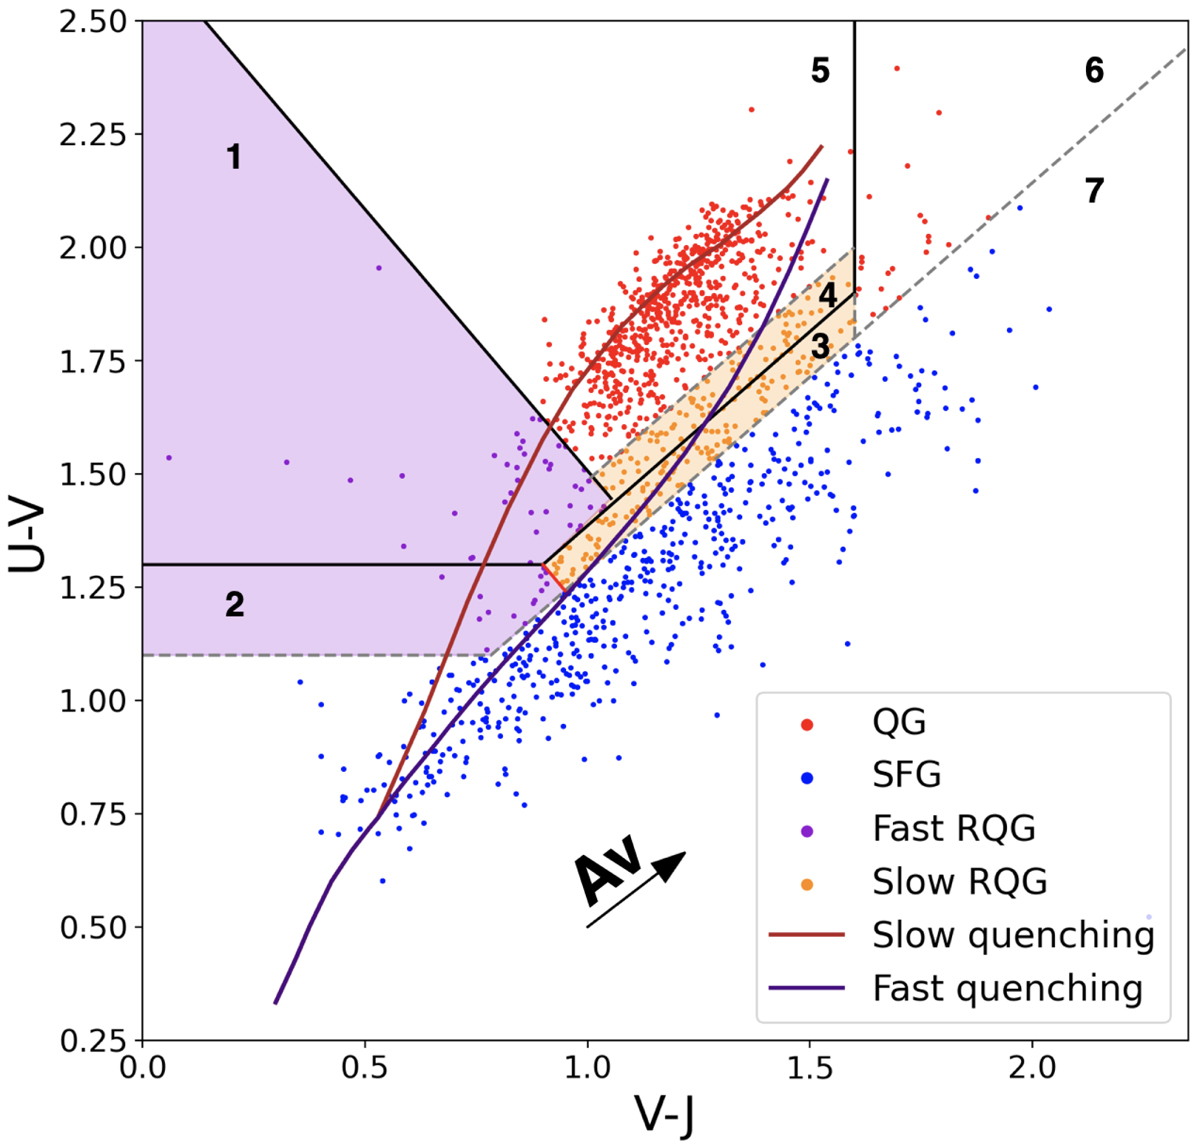
Fig. 3.
Download original image
Rest-frame UVJ diagram used to classify galaxy populations. The solid black lines are boundaries in Schreiber et al. (2018). The dashed lines are the modified boundaries used in this work (see Sect. 3.1.2). The red dots are QGs; blue dots are SFGs; purple and orange dots are both RQGs. The colour-shaded regions are RQG regions, and they are divided into fast- and slow-quenching regions. The two regions are divided by black and red diagonal solid lines according to evolution tracks (red and purple lines) of two model galaxies with a 1 and 0.1 Gyr quenching timescale, respectively (see Sect. 3.2). The arrow is the dust extinction vector corresponding to E(B − V)=0.1. Numbers indicate the different regions: 1 and 2 are fast-quenching RQG; 3 and 4 are slow-quenching RQG; 5 and 6 are QG; 7 is SFG.
Current usage metrics show cumulative count of Article Views (full-text article views including HTML views, PDF and ePub downloads, according to the available data) and Abstracts Views on Vision4Press platform.
Data correspond to usage on the plateform after 2015. The current usage metrics is available 48-96 hours after online publication and is updated daily on week days.
Initial download of the metrics may take a while.