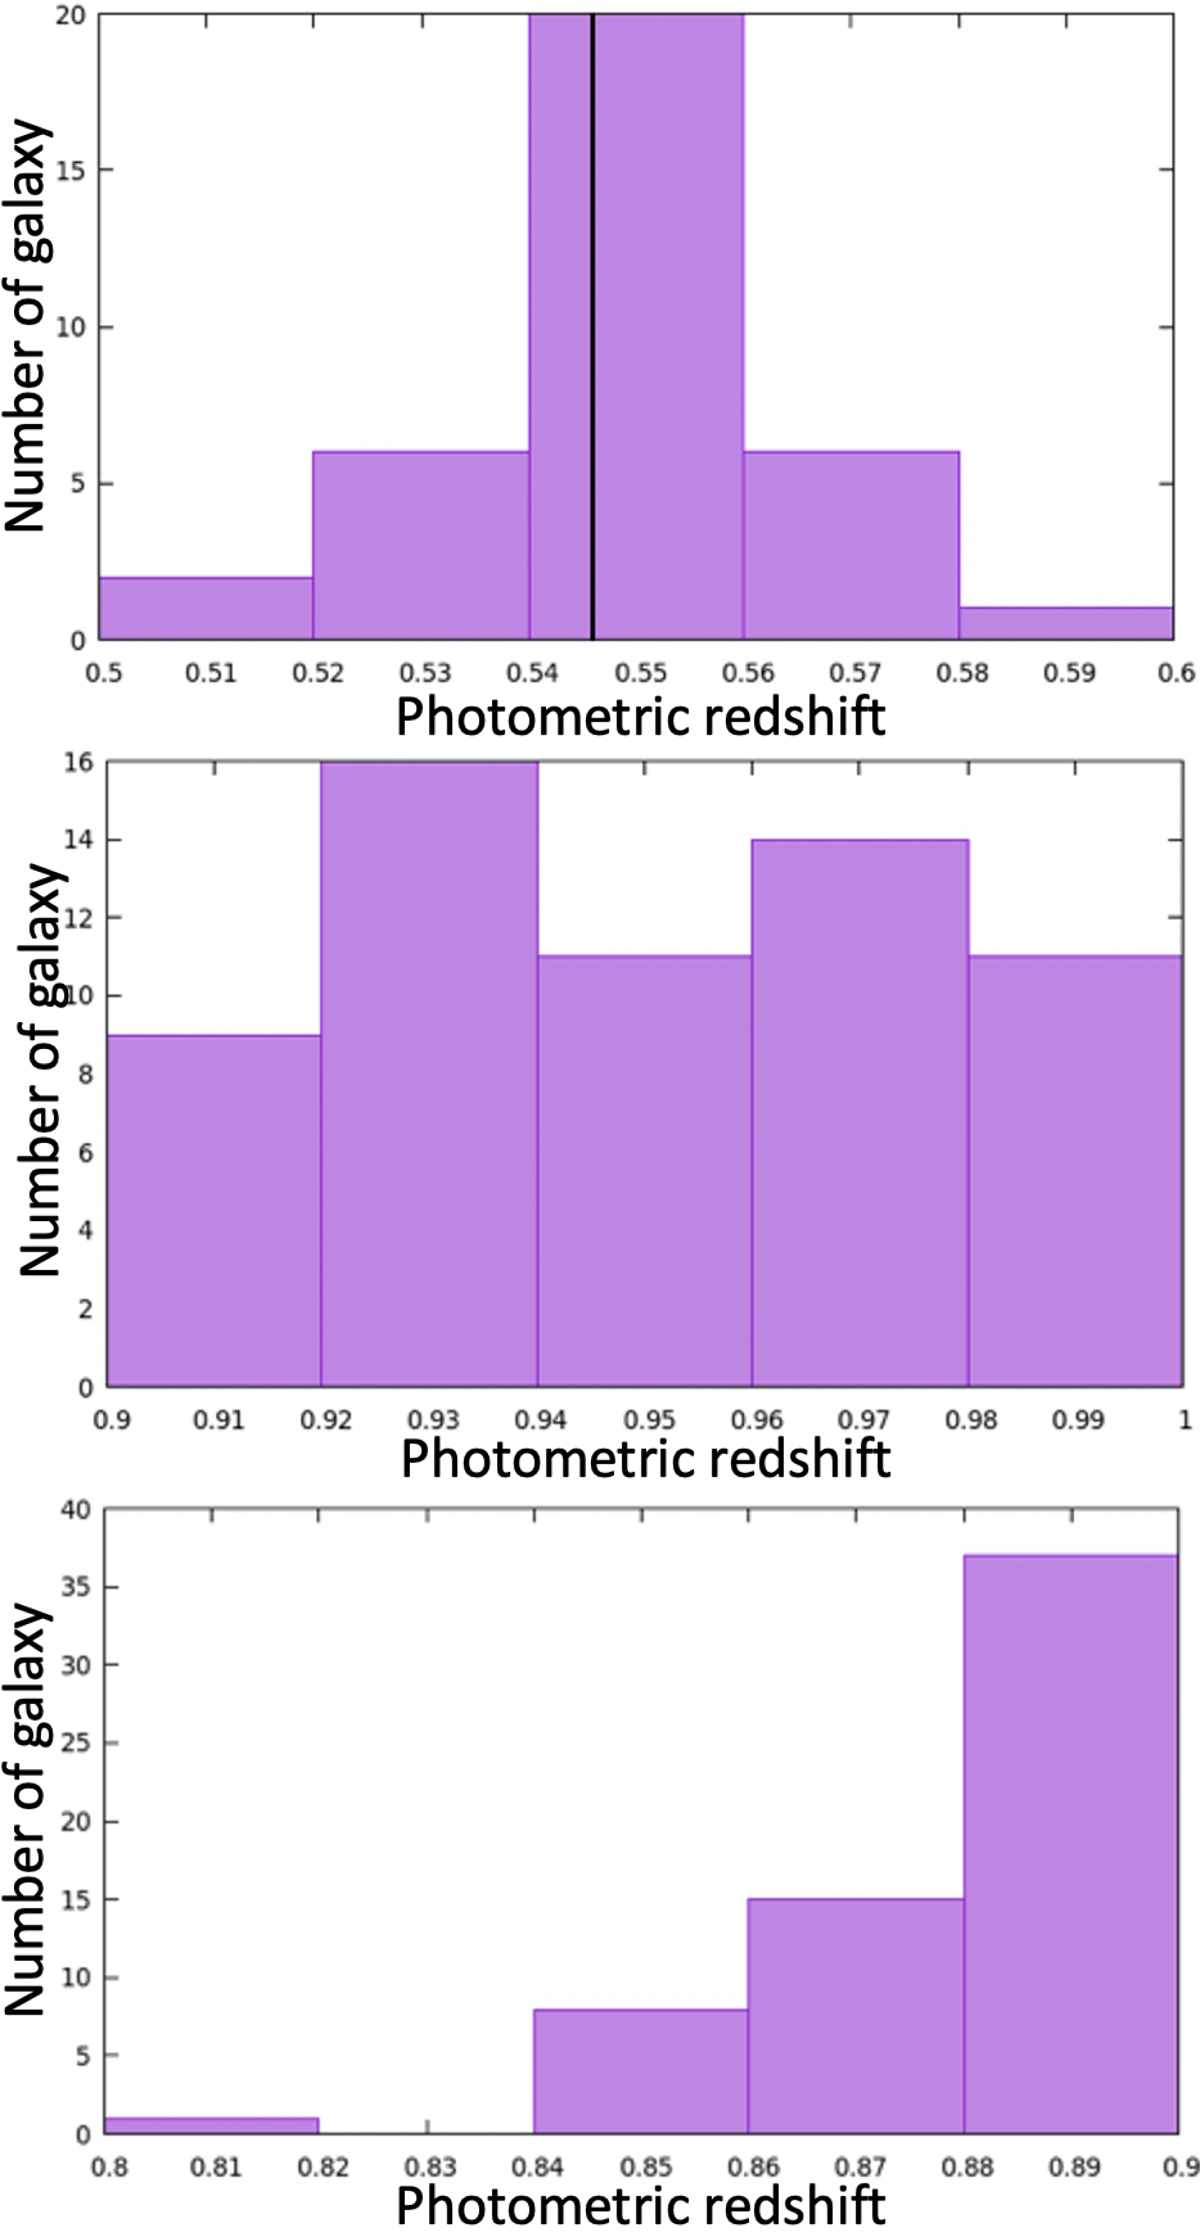
Fig. 2.
Download original image
Redshift distribution of three typical cases. The histograms show the distribution of photometric redshifts of galaxy members. Top panel: cluster candidate located within one redshift slice; the vertical line in this panel gives the mean photometric redshift value. Middle panel: flat distribution, indicating that this overdensity is not a physically connected structure. Bottom panel: distribution of a real structure, but its peak is close to the edge of our selection redshift slice, missing a large fraction of its galaxy members.
Current usage metrics show cumulative count of Article Views (full-text article views including HTML views, PDF and ePub downloads, according to the available data) and Abstracts Views on Vision4Press platform.
Data correspond to usage on the plateform after 2015. The current usage metrics is available 48-96 hours after online publication and is updated daily on week days.
Initial download of the metrics may take a while.