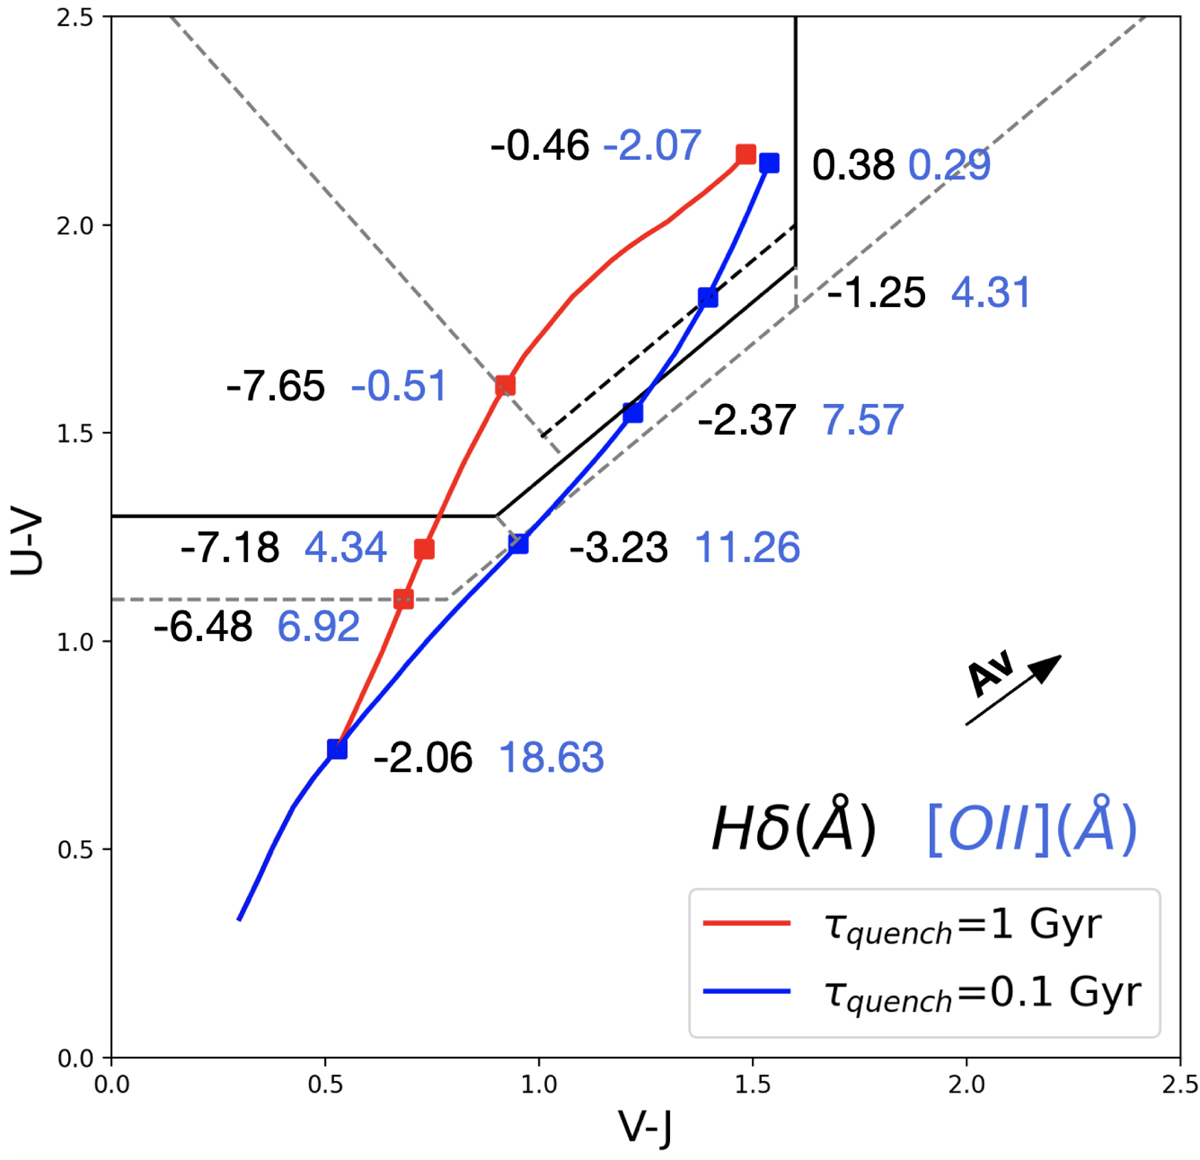
Fig. A.2.
Download original image
Equivalent width of the Hδ absorption line and [OII] emission line at different positions in UVJ space. The two evolutionary tracks are of galaxies with 1 Gyr star formation duration but different quenching timescales, E(B-V)=0.15. Values in blue show the EW of [OII] emission lines, values in black the EW of Hδ absorption lines. A negative value represents absorption, and a positive value represents emission.
Current usage metrics show cumulative count of Article Views (full-text article views including HTML views, PDF and ePub downloads, according to the available data) and Abstracts Views on Vision4Press platform.
Data correspond to usage on the plateform after 2015. The current usage metrics is available 48-96 hours after online publication and is updated daily on week days.
Initial download of the metrics may take a while.