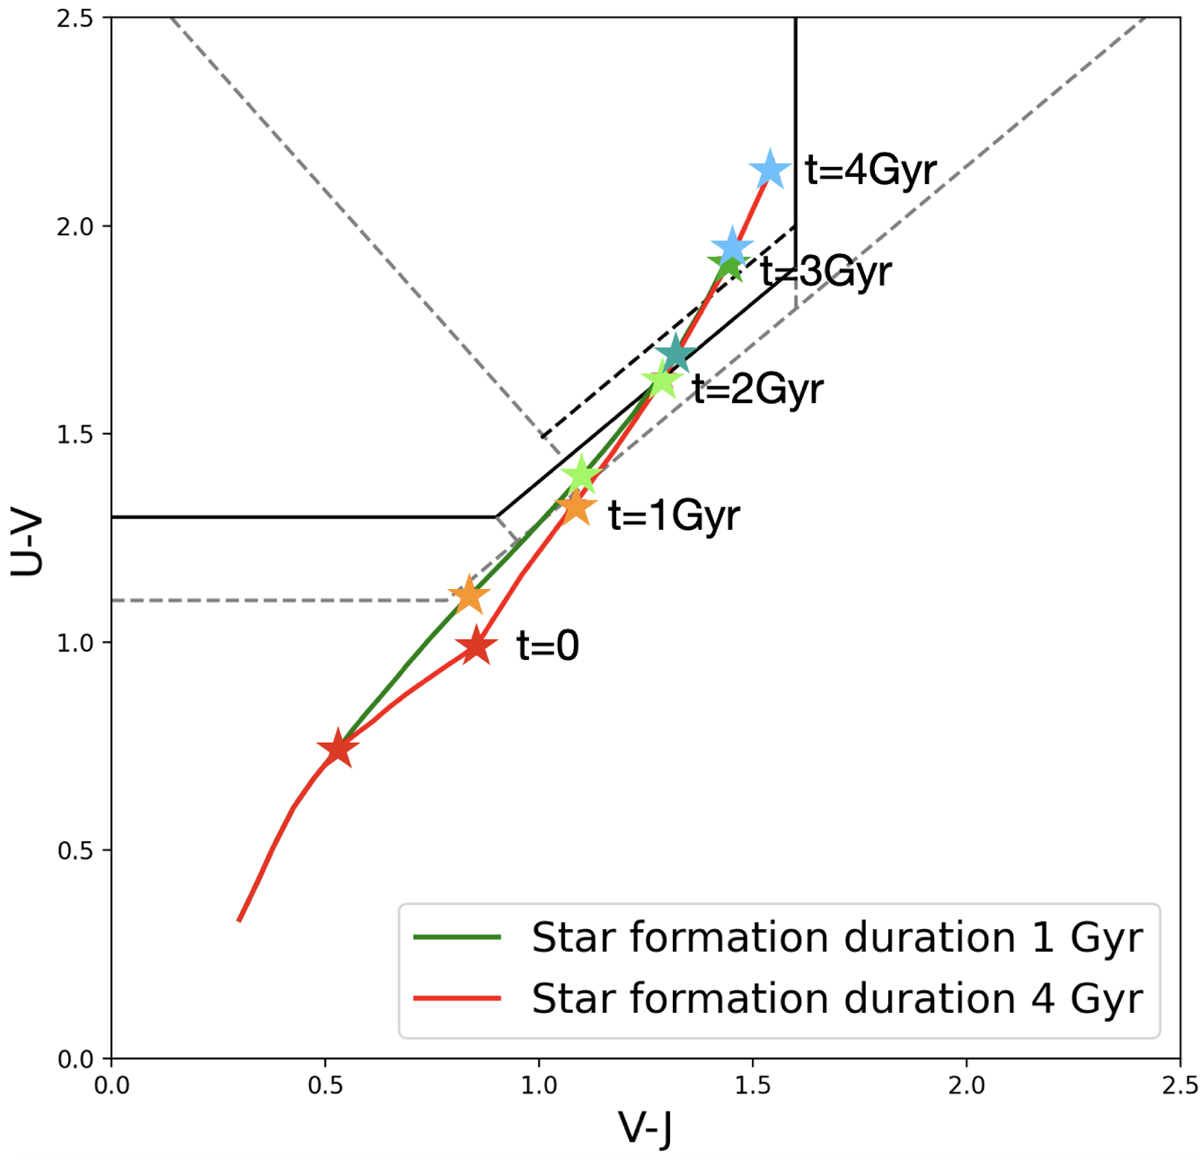
Fig. A.1.
Download original image
Galaxies with different star formation duration times in SFHs (see Fig. 4). The green line is a duration of 1 Gyr, and the red line is a duration of 4 Gyr, both with a quenching timescale of 1 Gyr. The star symbols show the time after the start of quenching. Symbols of the same colour on different curves show the same time after quenching.
Current usage metrics show cumulative count of Article Views (full-text article views including HTML views, PDF and ePub downloads, according to the available data) and Abstracts Views on Vision4Press platform.
Data correspond to usage on the plateform after 2015. The current usage metrics is available 48-96 hours after online publication and is updated daily on week days.
Initial download of the metrics may take a while.