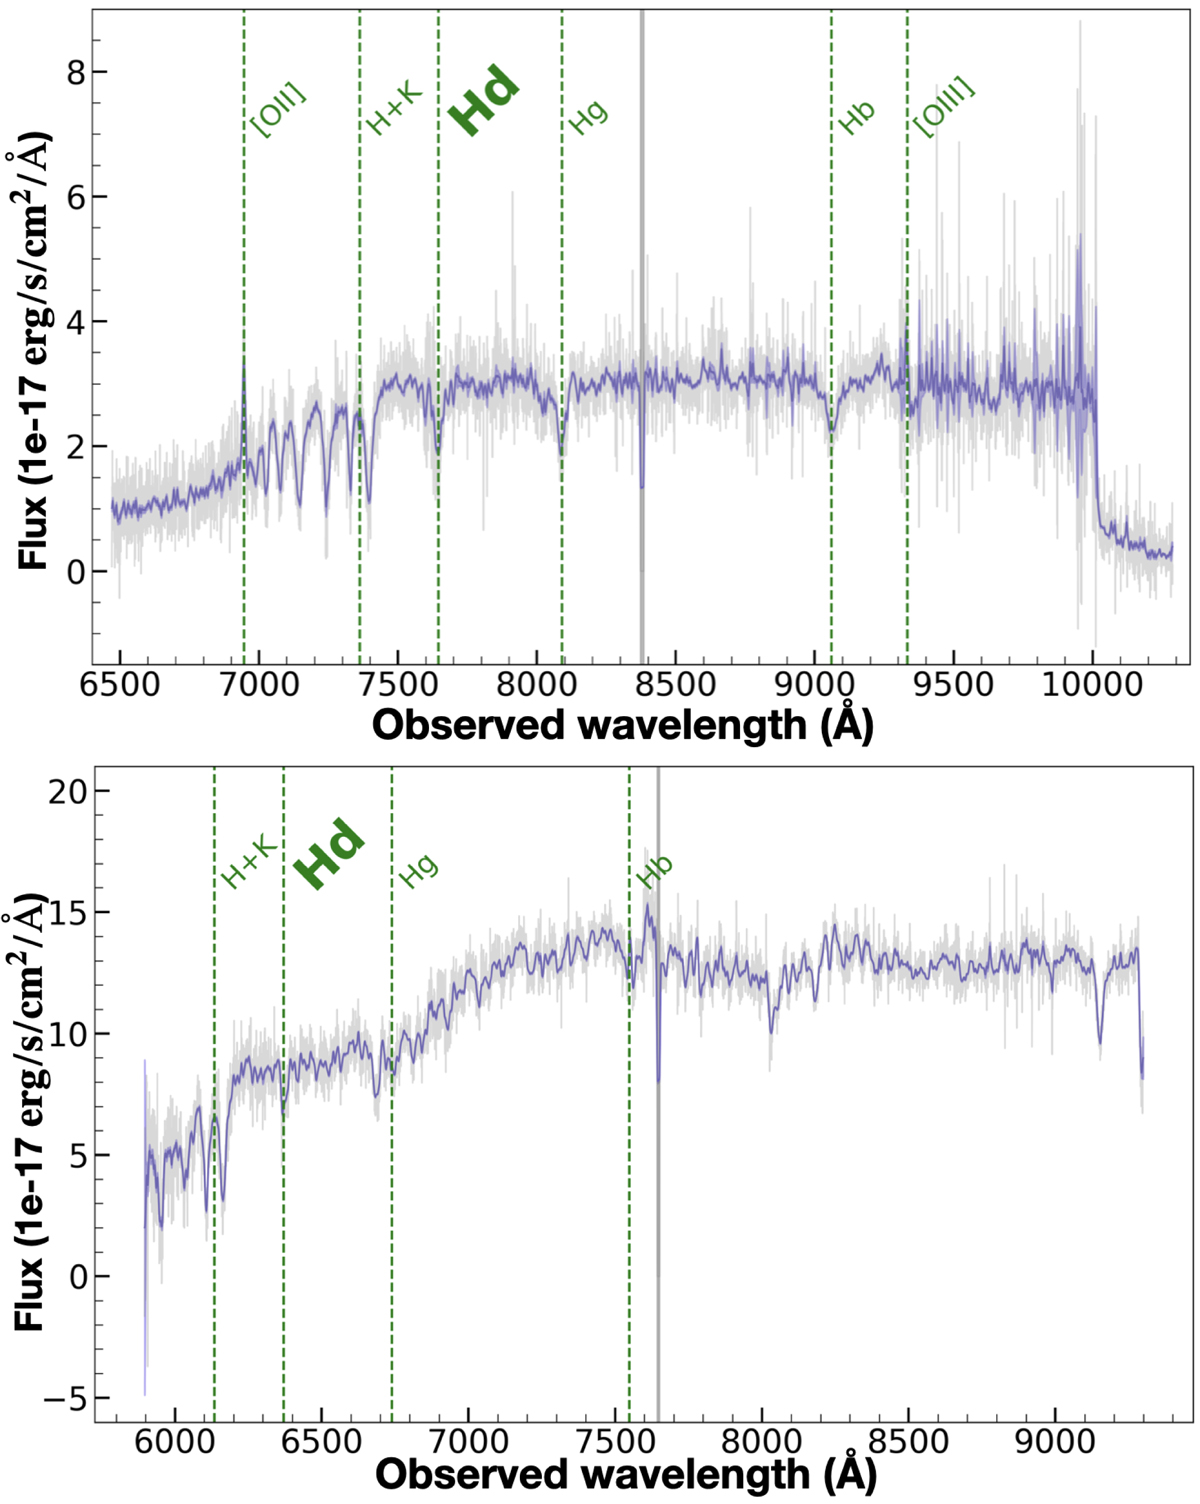
Fig. 15.
Download original image
Two checked galaxy spectra (in observed frame). Spectral features are indicated with green dashed lines. An artificial break between two chips of the DEIMOS spectrograph is shown as a grey shaded area. Top panel: typical spectrum for strong Balmer absorption line galaxy, at z = 0.864. Bottom panel: typical spectrum for weak Balmer absorption line galaxy, at z = 0.553.
Current usage metrics show cumulative count of Article Views (full-text article views including HTML views, PDF and ePub downloads, according to the available data) and Abstracts Views on Vision4Press platform.
Data correspond to usage on the plateform after 2015. The current usage metrics is available 48-96 hours after online publication and is updated daily on week days.
Initial download of the metrics may take a while.