Fig. 1.
Download original image
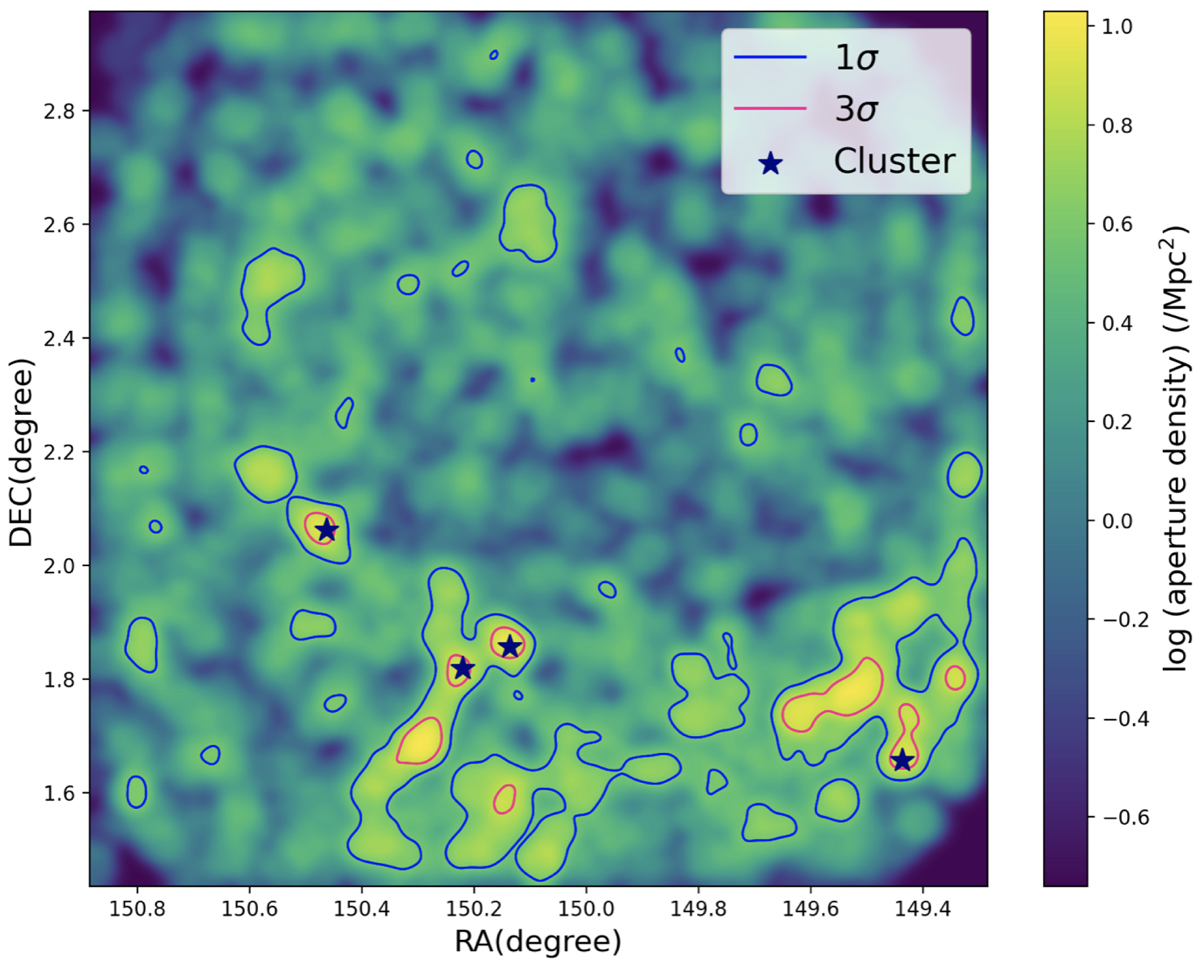
Aperture density map of a redshift slice at z ∼ 0.5 − 0.6. The colours show aperture density in the logarithm scale. The red contours indicate the edge of 3σ peaks, and the blue contours the edge of 1σ regions. The area outside the 1σ contours is identified as field. This kind of density map is plotted for all redshift slices to select cluster candidates and construct the field sample, which is used to make a statistical subtraction of the field average density. Stars indicate the confirmed cluster candidates analysed in this work.
Current usage metrics show cumulative count of Article Views (full-text article views including HTML views, PDF and ePub downloads, according to the available data) and Abstracts Views on Vision4Press platform.
Data correspond to usage on the plateform after 2015. The current usage metrics is available 48-96 hours after online publication and is updated daily on week days.
Initial download of the metrics may take a while.