Fig. 14.
Download original image
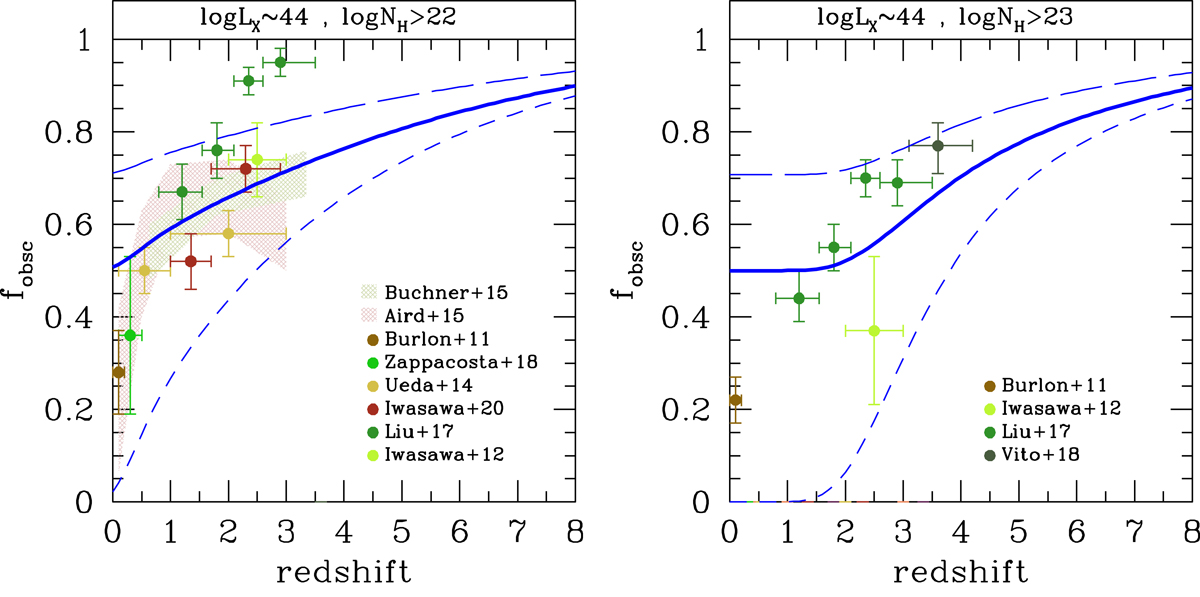
Total fraction of obscured AGN with log NH > 22 (left panel) and log NH > 23 (right panel) vs. redshift measured in different X-ray samples (see labels) and compared with model curves of large-scale (ISM) plus small-scale (torus) obscuration. Only samples with median log LX ≈ 44 have been considered here (see text for details). Curves have the same meaning as in Fig. 13. The model with γ = 2 and θtorus = 60° (thick solid blue line) provides a good representation of the data.
Current usage metrics show cumulative count of Article Views (full-text article views including HTML views, PDF and ePub downloads, according to the available data) and Abstracts Views on Vision4Press platform.
Data correspond to usage on the plateform after 2015. The current usage metrics is available 48-96 hours after online publication and is updated daily on week days.
Initial download of the metrics may take a while.