Fig. 8.
Download original image
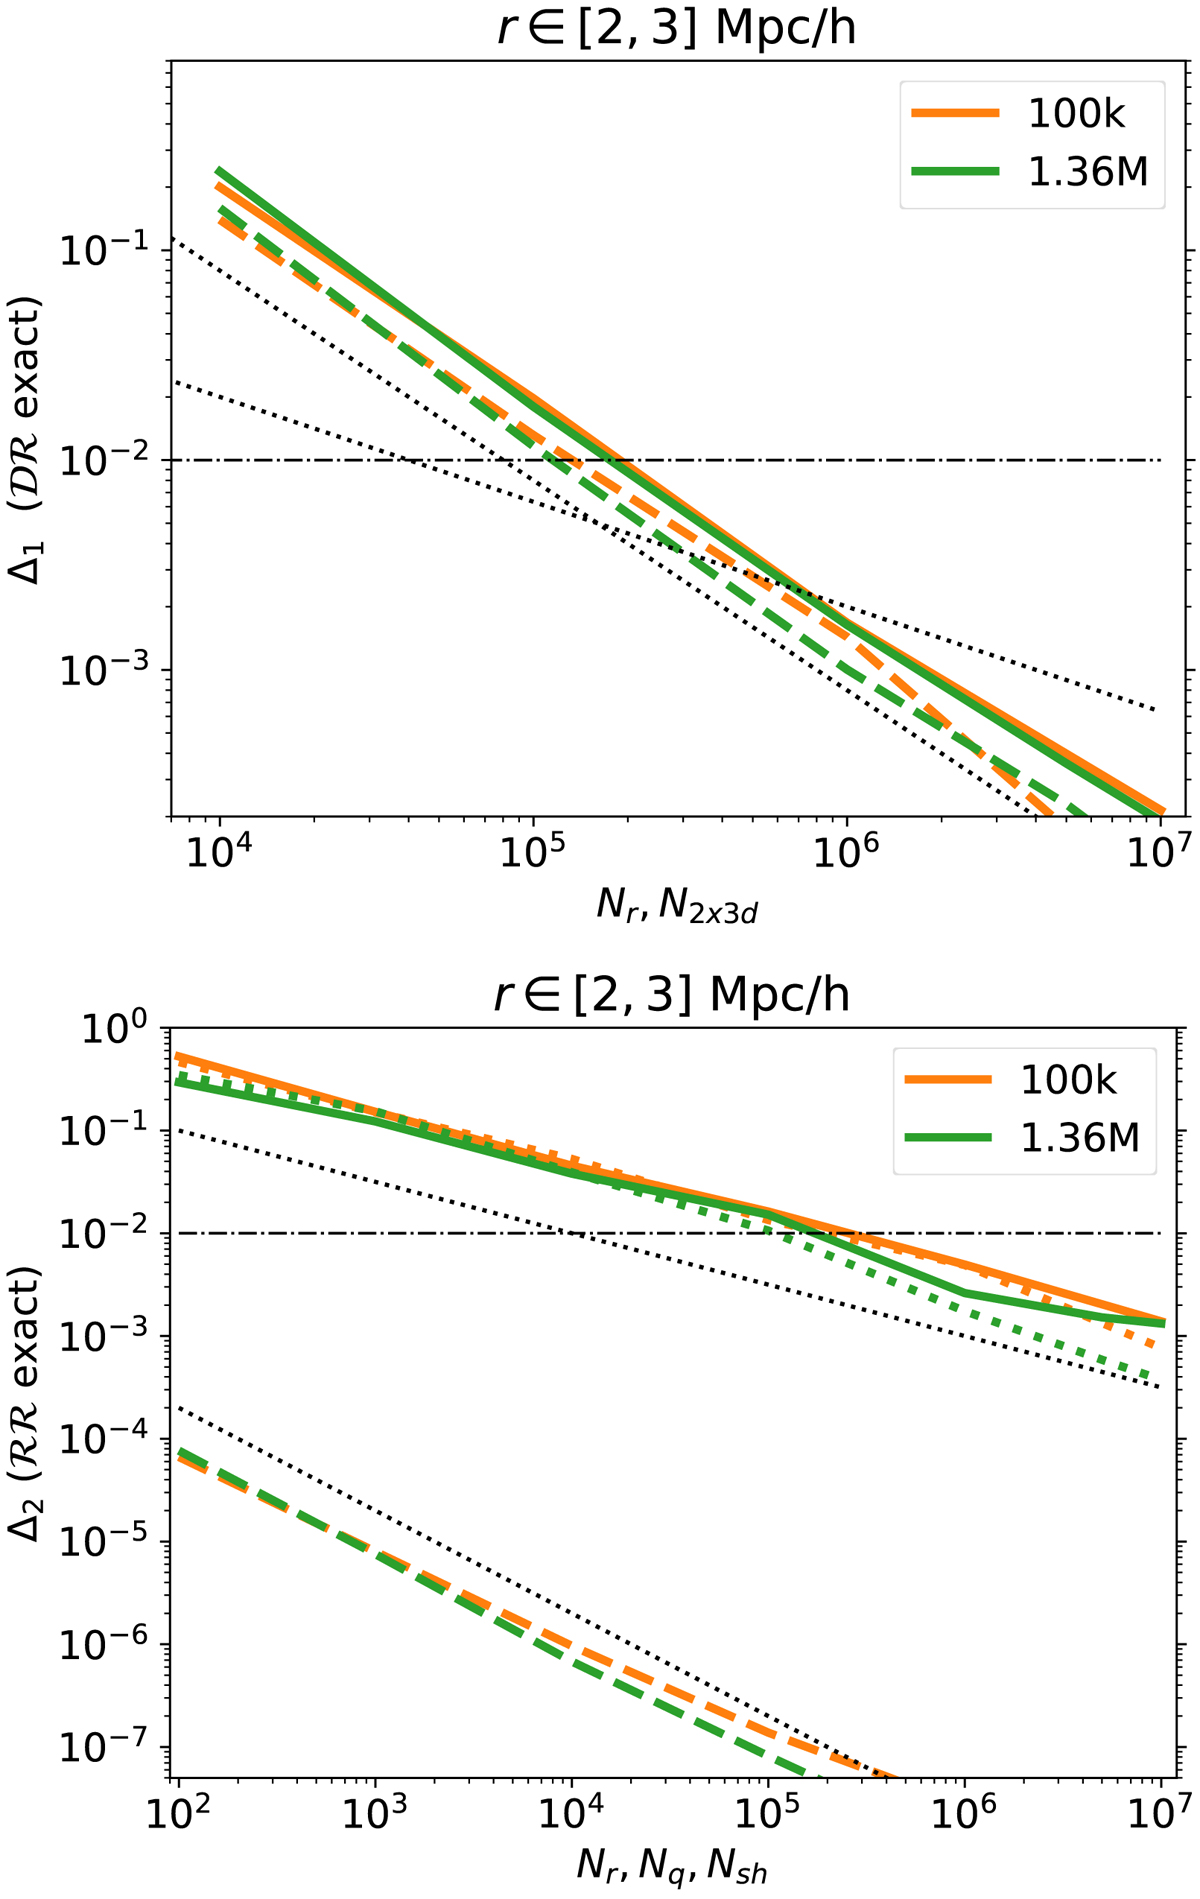
Errors for estimates of the correlation function at r ∈ [2, 3] Mpc h−1 from 1.36 million galaxies and a subsample of 100 k galaxies in a box with side-length 325 Mpc h−1. Upper plot: absolute error Δ1 shown for the standard RR (solid lines) and for RR2x3d (dashed lines) pair-counts. Lower plot: absolute error Δ2 is shown for the standard DR (solid lines), the DR using a low-discrepancy sequence (dotted lines), and for DRshell also using a low-discrepancy sequence (dashed lines). The black dotted lines are proportional to ![]() (upper) and 1/N2x3d (lower).
(upper) and 1/N2x3d (lower).
Current usage metrics show cumulative count of Article Views (full-text article views including HTML views, PDF and ePub downloads, according to the available data) and Abstracts Views on Vision4Press platform.
Data correspond to usage on the plateform after 2015. The current usage metrics is available 48-96 hours after online publication and is updated daily on week days.
Initial download of the metrics may take a while.