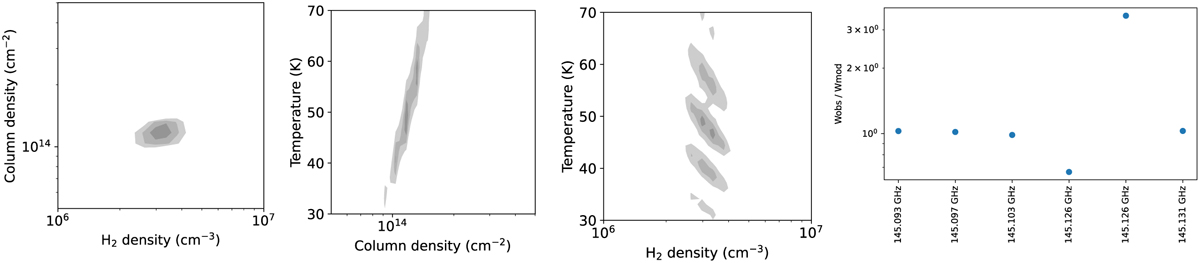
Fig. E.1
Download original image
Results of the χ2 minimization using the six observed lines of CH3OH. For each of the three plots on the left, the χ2 is projected over the third axis, which is not shown in the figure. Gray contours represent the 1σ, 2σ, and 3σ confidence intervals. The plot on the right represents the ratio of the observed and modeled integrated intensity for each of the methanol lines and the best model obtained by the χ2 minimization.
Current usage metrics show cumulative count of Article Views (full-text article views including HTML views, PDF and ePub downloads, according to the available data) and Abstracts Views on Vision4Press platform.
Data correspond to usage on the plateform after 2015. The current usage metrics is available 48-96 hours after online publication and is updated daily on week days.
Initial download of the metrics may take a while.