Open Access
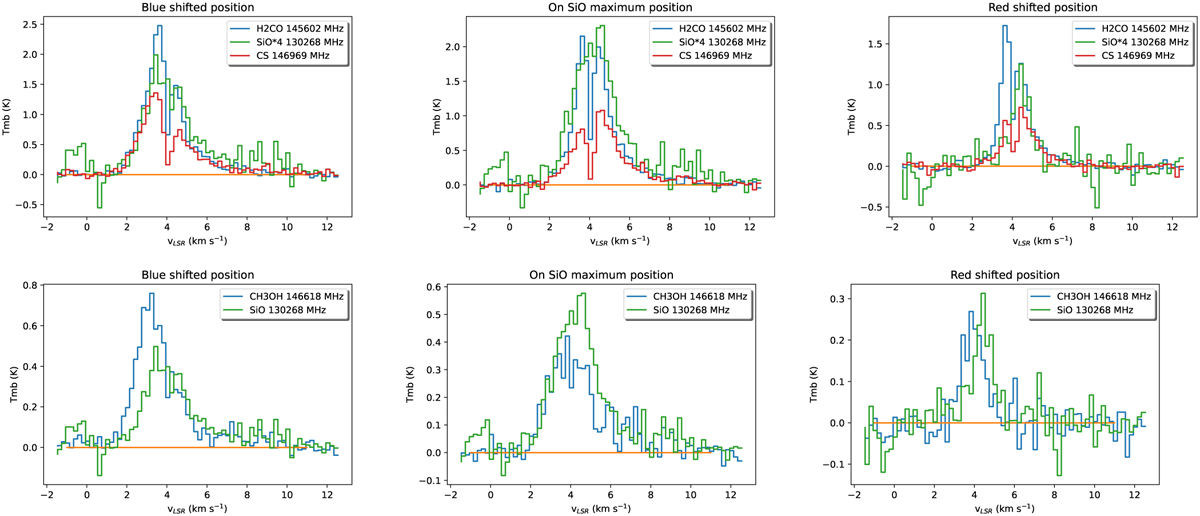
Fig. 2
Download original image
Comparison of the spectral line profiles of the transitions of H2CO, CS, SiO, and CH3OH at three different positions: maximum SiO total integrated intensity position (middle panel), at the blueshifted position ((+0.60″,+0.73″), left panel), and at the redshifted position ((0″, −0.87″), right panel).
Current usage metrics show cumulative count of Article Views (full-text article views including HTML views, PDF and ePub downloads, according to the available data) and Abstracts Views on Vision4Press platform.
Data correspond to usage on the plateform after 2015. The current usage metrics is available 48-96 hours after online publication and is updated daily on week days.
Initial download of the metrics may take a while.