Fig. 1
Download original image
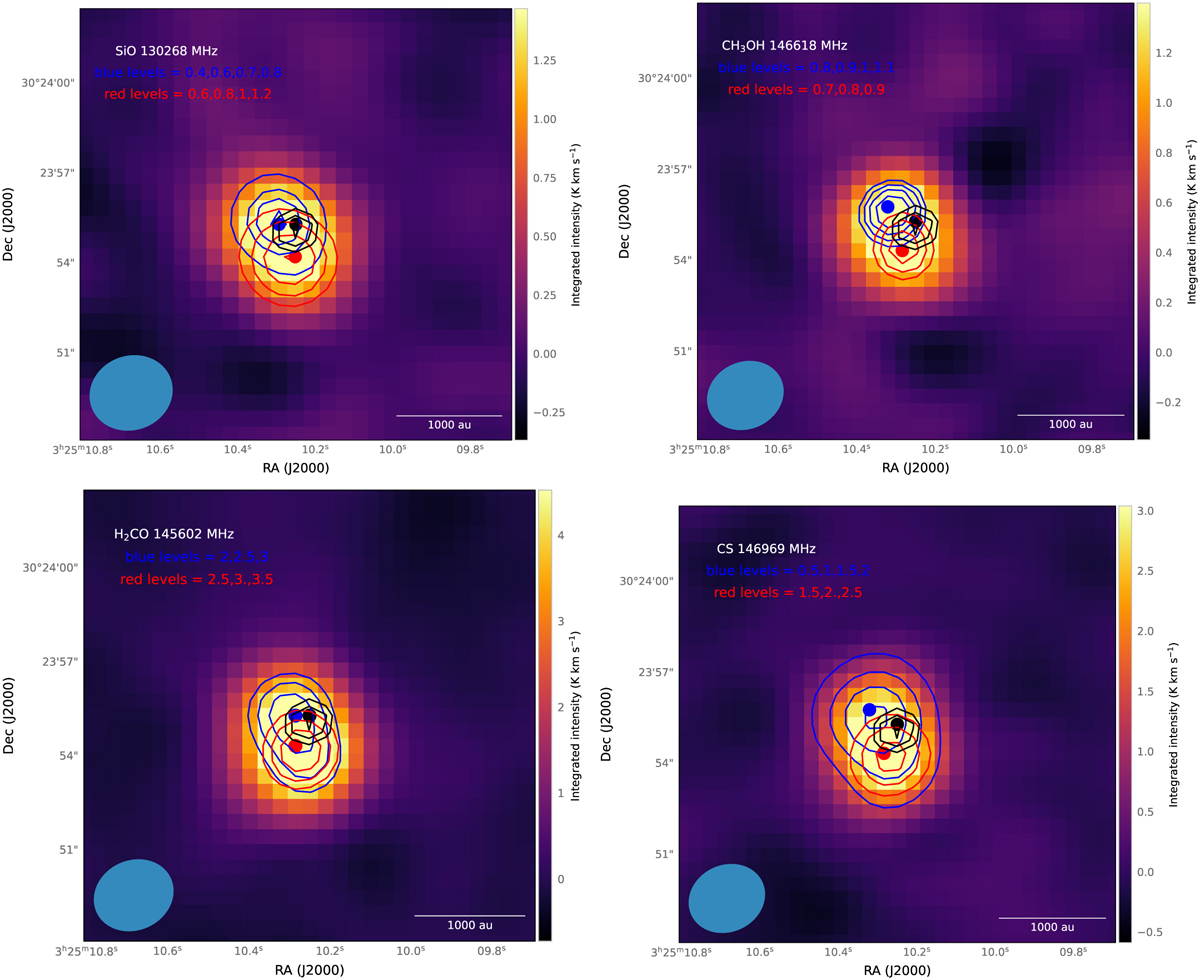
Integrated intensity maps over all velocities for SiO, CH3OH, H2CO, and CS (color coding). Superimposed are the blue (2.09–3.94 km s−1) and red (3.94–7.32 km s−1) emissions for each molecule. Blue and red dots indicate the position of the maximum emissions. The level of each contour (in K km s−1) is indicated in each figure. The color map is the integrated intensity map of each line integrated over all velocities. The black contours show the continuum emission, and the black dot shows its maximum. The levels for the continuum are 5.5 × 10⁻³, 6.0 × 10⁻³, and 6.5 × 10⁻³ mJy.
Current usage metrics show cumulative count of Article Views (full-text article views including HTML views, PDF and ePub downloads, according to the available data) and Abstracts Views on Vision4Press platform.
Data correspond to usage on the plateform after 2015. The current usage metrics is available 48-96 hours after online publication and is updated daily on week days.
Initial download of the metrics may take a while.