Open Access
Fig. 7
Download original image
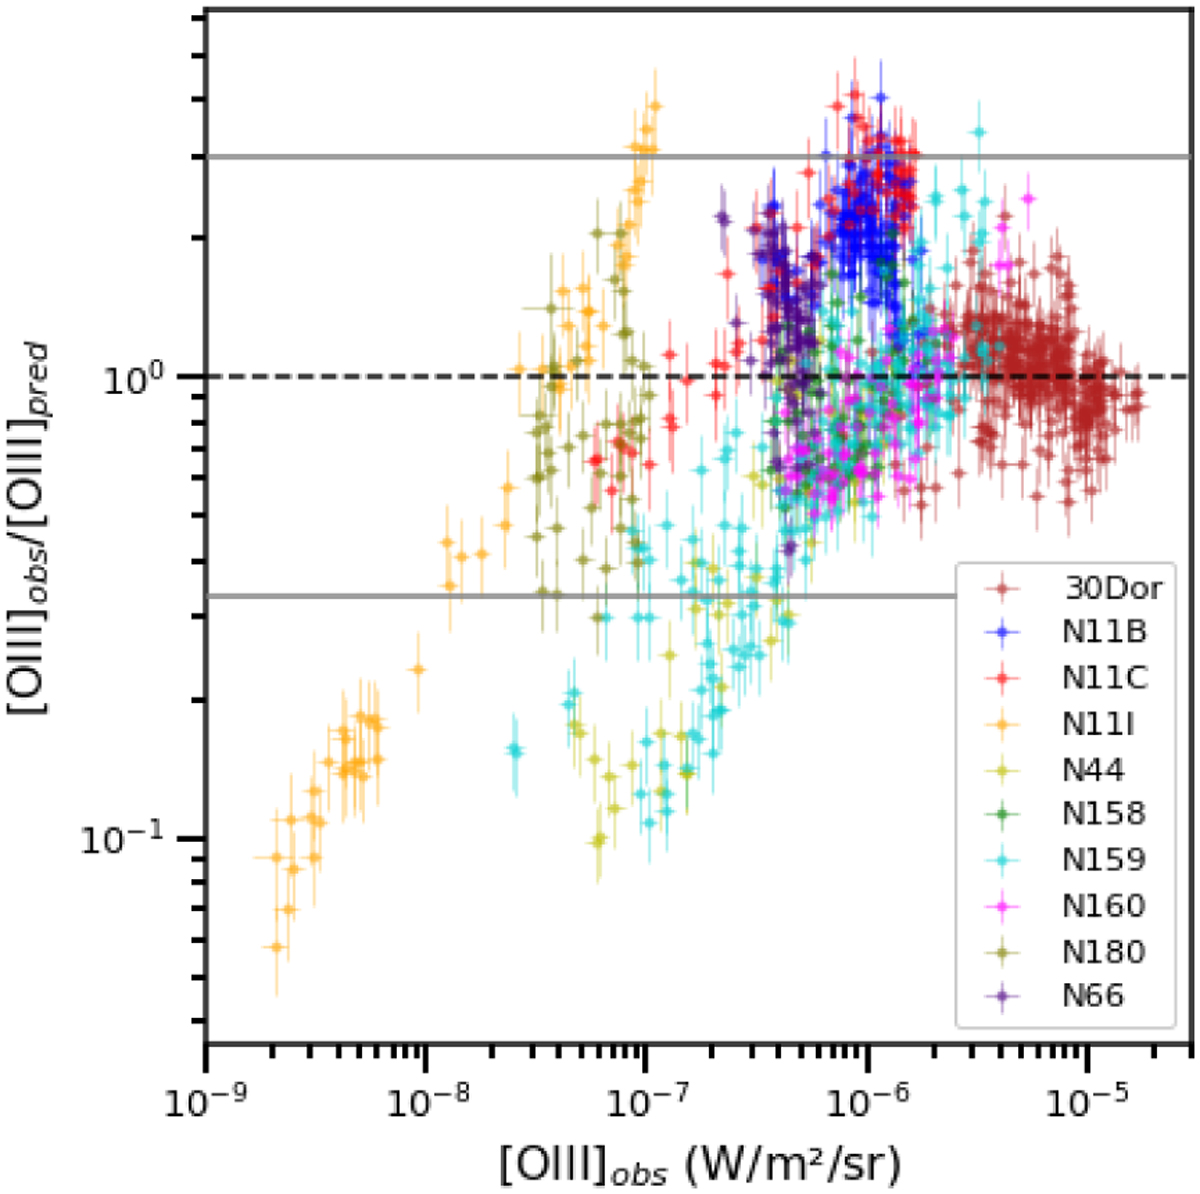
Spatially resolved ratios of observed ([O iii]obs) over predicted ([O iii]pred) emission of [O iii]. The value of 1, corresponding to good agreement of the predictions and the observations, is indicated with a horizontal dashed line. The horizontal gray lines indicate differences of a factor 3 from agreement.
Current usage metrics show cumulative count of Article Views (full-text article views including HTML views, PDF and ePub downloads, according to the available data) and Abstracts Views on Vision4Press platform.
Data correspond to usage on the plateform after 2015. The current usage metrics is available 48-96 hours after online publication and is updated daily on week days.
Initial download of the metrics may take a while.