Open Access
Fig. 5
Download original image
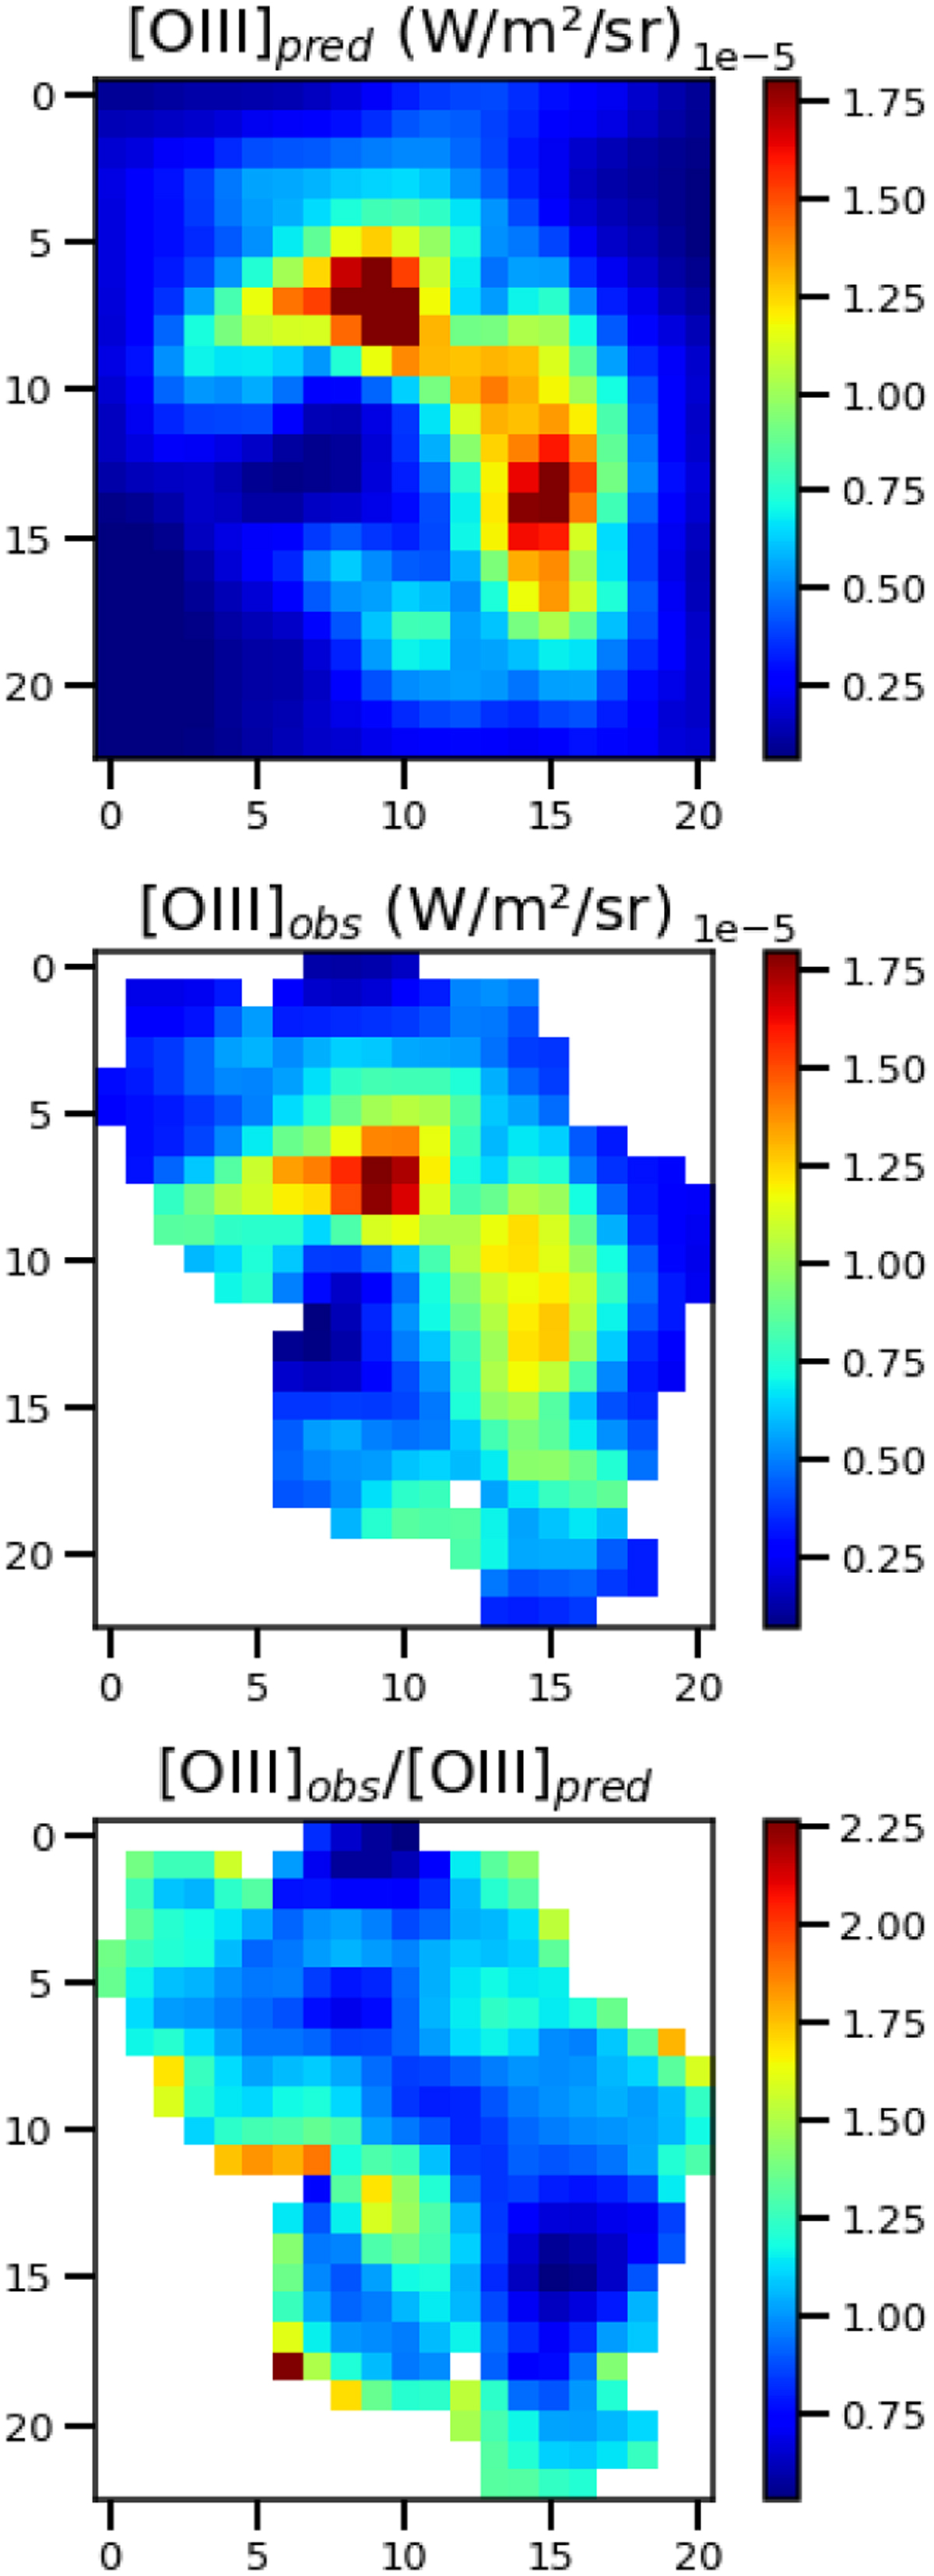
Predicted 30 Dor map of [O iii] (top panel) given the observed 24 µm and Eq. (1). For comparison, the actual observed map of [O iii] (middle panel), and the ratio of observed over predicted emission (lower panel). The two maps of [O iii] are represented on the same scale and are displayed in Wm−2 sr−1.
Current usage metrics show cumulative count of Article Views (full-text article views including HTML views, PDF and ePub downloads, according to the available data) and Abstracts Views on Vision4Press platform.
Data correspond to usage on the plateform after 2015. The current usage metrics is available 48-96 hours after online publication and is updated daily on week days.
Initial download of the metrics may take a while.