Fig. 4
Download original image
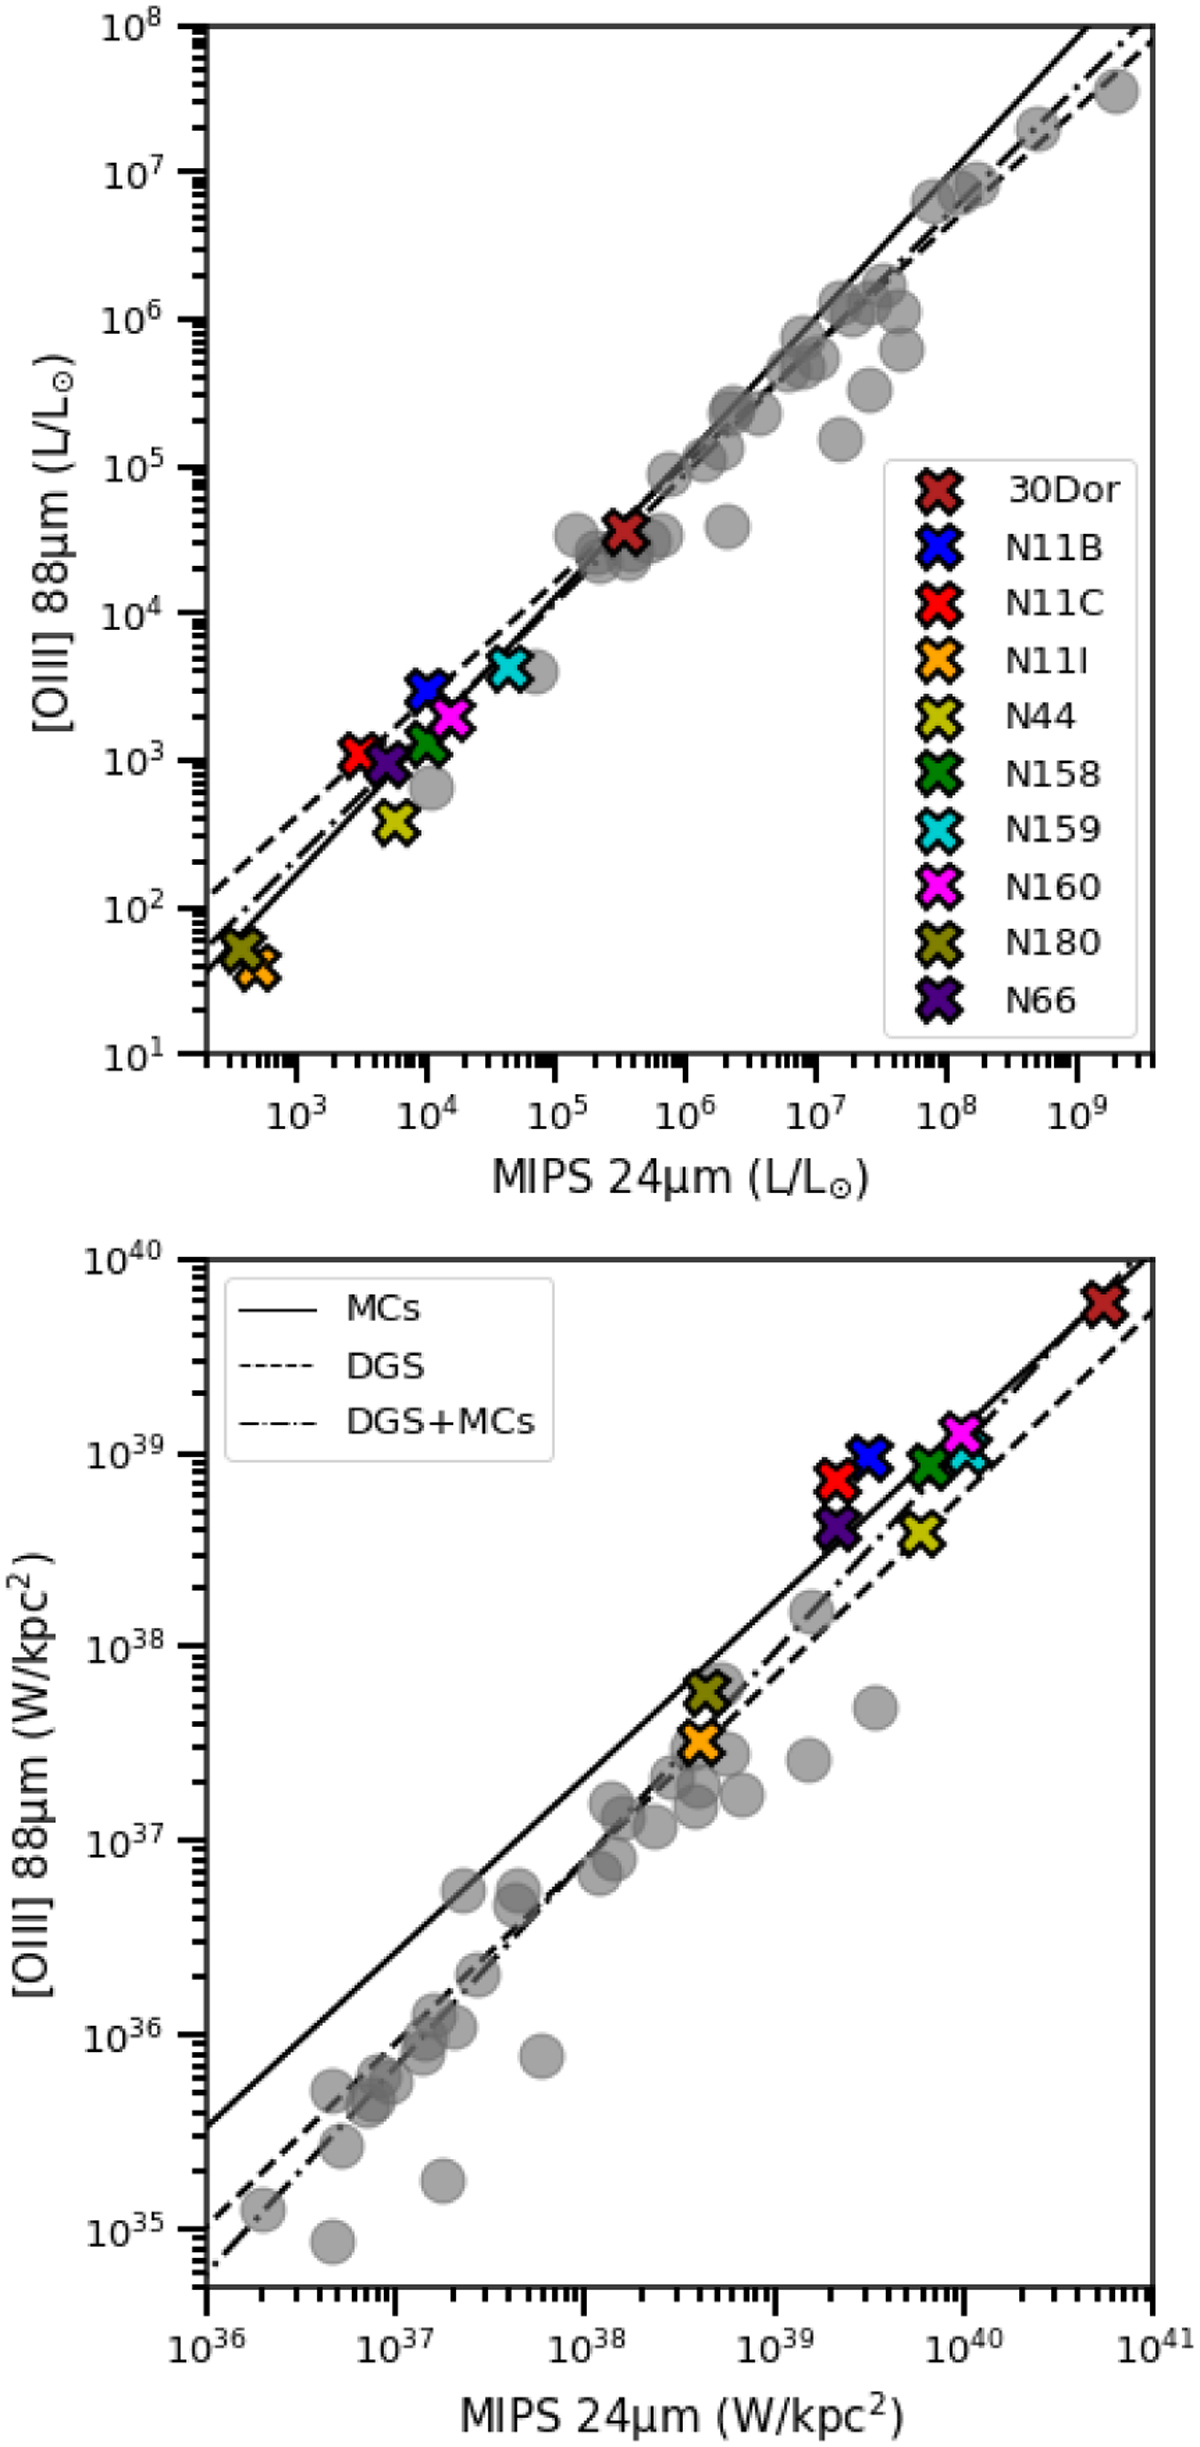
Upper panel: relation between the integrated [O iii] and 24 µm luminosity, in units of solar luminosity (L⊙). Lower panel: integrated luminosity per surface area of [O iii] and 24 µm (Wkpc−2). The DGS sample corresponds to the gray circles, and the integrated regions from the Magellanic Cloud sample are coded with colors, as indicated in the inserted legend in the upper panel. The fit on the Magellanic Clouds alone is indicated as MCs, the fit on DGS sample is indicated as DGS, and the fit on the whole data is indicated as DGS+MCs.
Current usage metrics show cumulative count of Article Views (full-text article views including HTML views, PDF and ePub downloads, according to the available data) and Abstracts Views on Vision4Press platform.
Data correspond to usage on the plateform after 2015. The current usage metrics is available 48-96 hours after online publication and is updated daily on week days.
Initial download of the metrics may take a while.