Fig. 3
Download original image
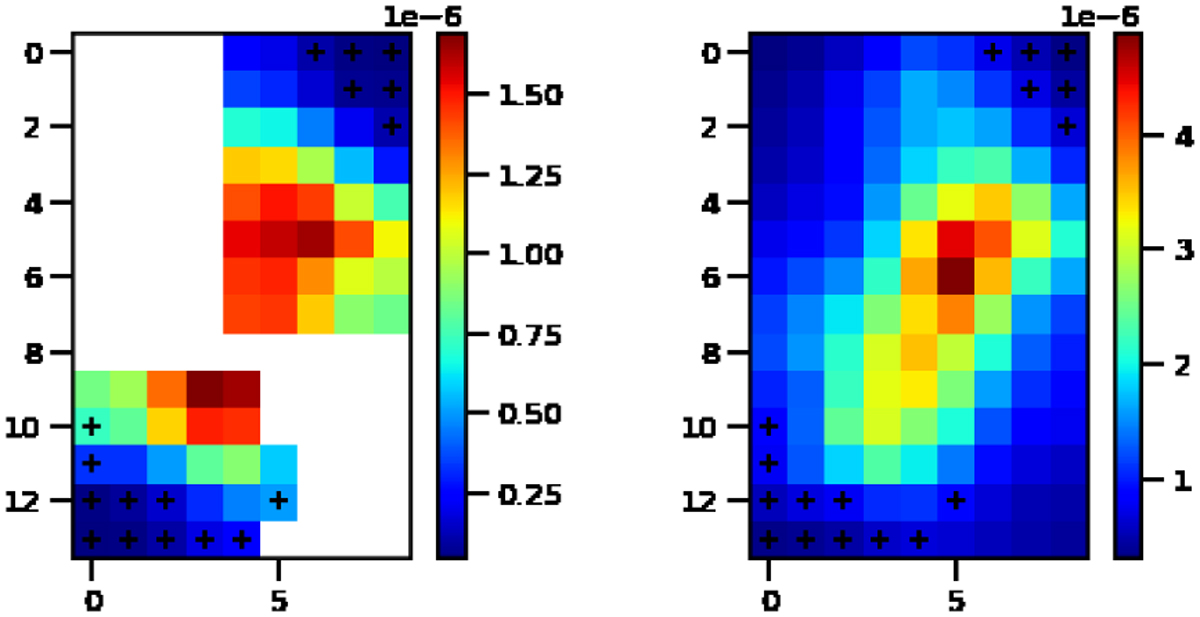
Spatial distribution of the low emission pixels in N11C. Left panel: [O iii] map for N11C; right panel: MIPS 24 µm map for N11C. Both maps are convolved to 12″ and resampled to 12″ pixels. The black crosses correspond to pixels that have low surface brightness (on the left of the bulk of the regions in Figs. 1 and 2, corresponding to values of 24 µm lower than 106 W m−2 sr−1) showing a different behavior from that of the global relation.
Current usage metrics show cumulative count of Article Views (full-text article views including HTML views, PDF and ePub downloads, according to the available data) and Abstracts Views on Vision4Press platform.
Data correspond to usage on the plateform after 2015. The current usage metrics is available 48-96 hours after online publication and is updated daily on week days.
Initial download of the metrics may take a while.