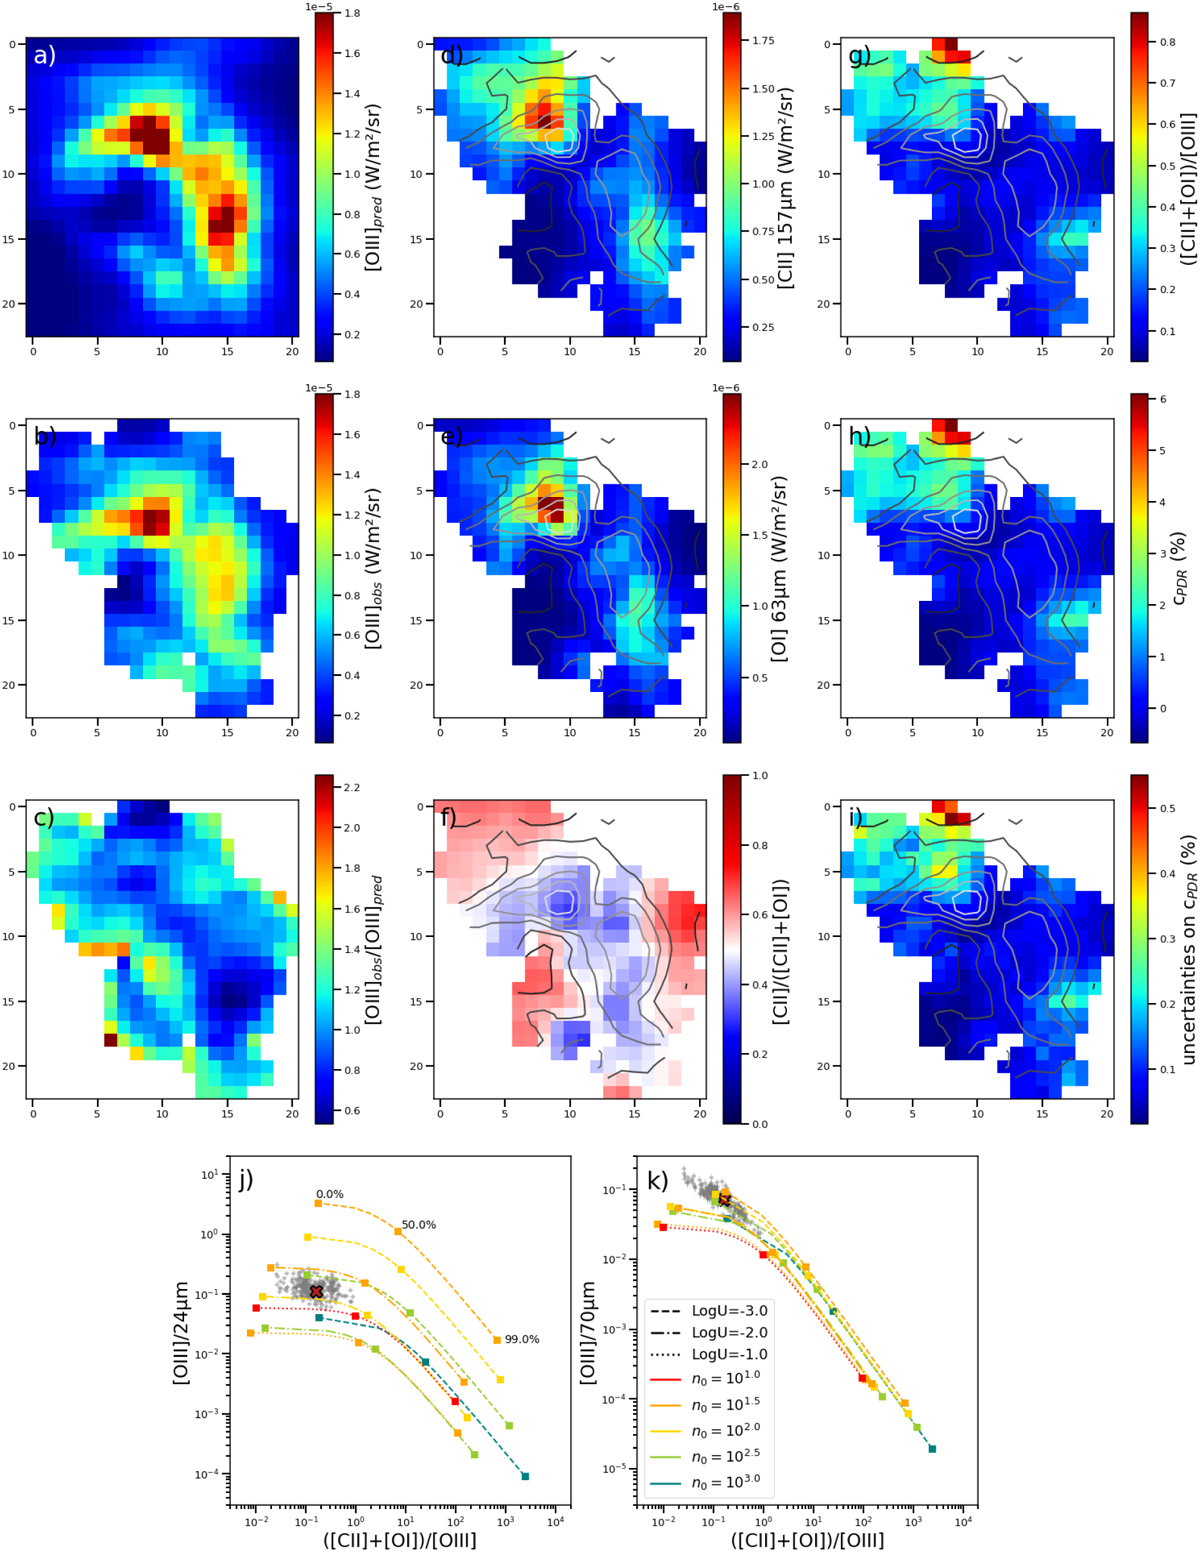
Fig. C.1
Download original image
For the region 30 Dor, the predicted map of [O iii] given the observed 24µm (panel a) is compared to the actual map of [O iii] observed with Herschel/PACS (panel b), and the ratio of observed over predicted emission (panel c). The distribution of [C ii] and [O i] emission (panels d and e respectively) are overlaid with the [O iii] line contours. The ratio of RCII/PDR (panel f), RPDR/HII (panel g) and cPDR with associated uncertainties (panel h and i respectively) are also presented with the [O iii] line contours. The observed ratios [O iii]/24µm and [O iii]/70µm presented as a function of RPDR/HII are compared to our grid of models (panelj and k respectively). The large cross is the value integrated on the global region.
Current usage metrics show cumulative count of Article Views (full-text article views including HTML views, PDF and ePub downloads, according to the available data) and Abstracts Views on Vision4Press platform.
Data correspond to usage on the plateform after 2015. The current usage metrics is available 48-96 hours after online publication and is updated daily on week days.
Initial download of the metrics may take a while.