Fig. B.3
Download original image
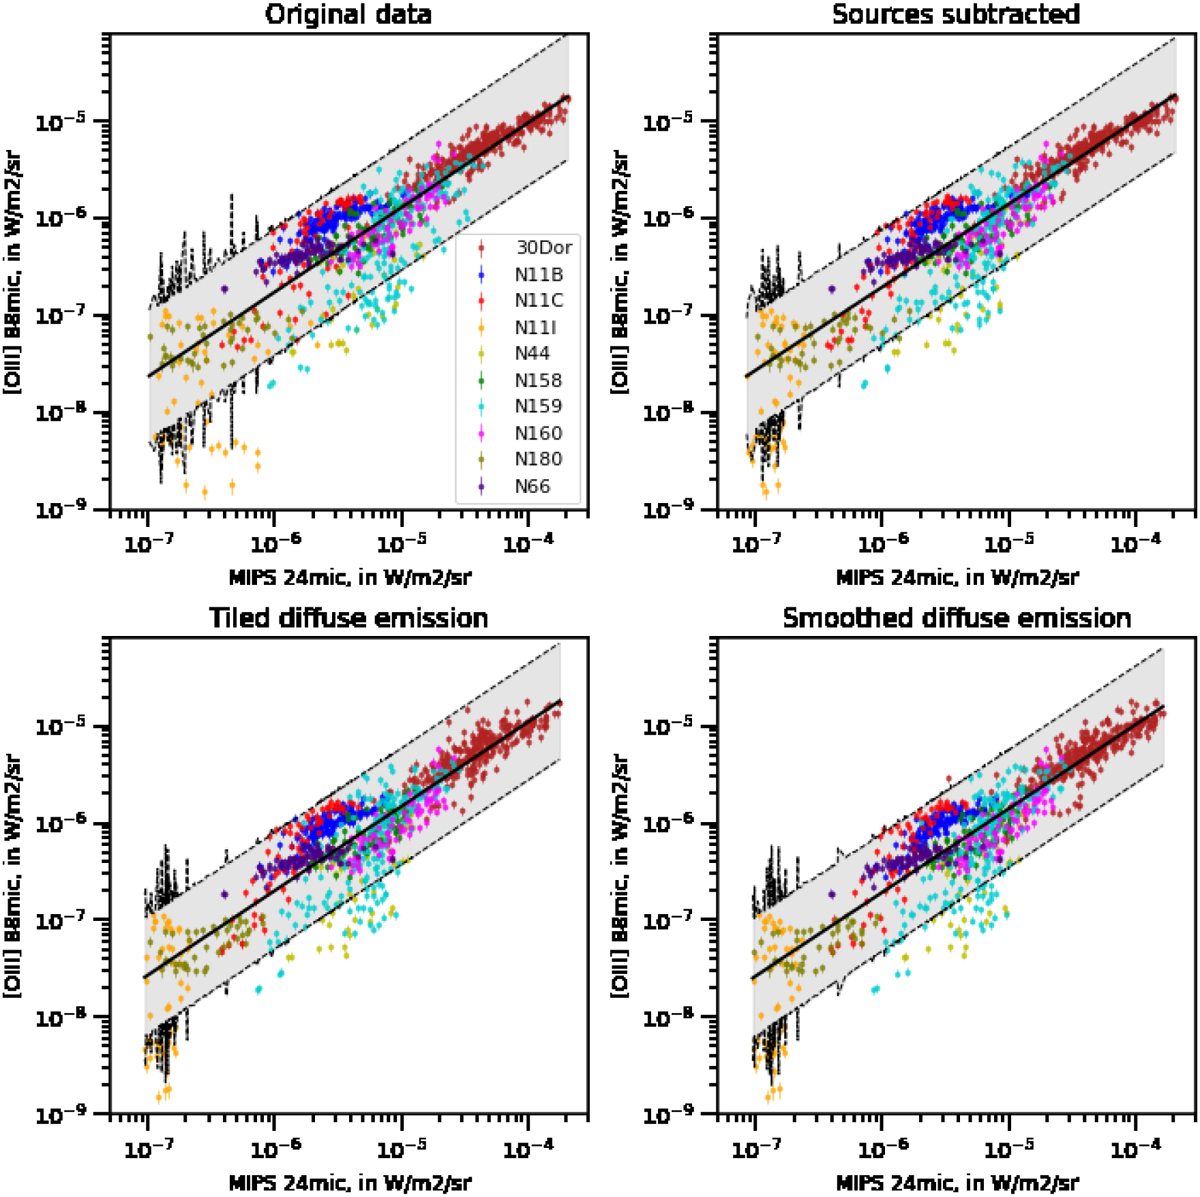
Results of the fit with different treatment of point-sources in the 24µm maps. The original MIPS 24µm maps (upper left panel), tiled (lower left panel) and smoothed background (lower right panel) calculated by the software extracting the point sources, and the original maps with emission from the extracted point sources subtracted (upper right panel). The two first maps of the diffuse emission are outputs from the software, where the last one is the software estimation of the point sources emission subtracted from the initial map. The black solid line represents the fitted relation between the [O iii] emission line and the 24µm band and the black dashed lines and the gray shading indicate the 95% confidence intervals. Fitted parameters for the different cases are in Table B.3
Current usage metrics show cumulative count of Article Views (full-text article views including HTML views, PDF and ePub downloads, according to the available data) and Abstracts Views on Vision4Press platform.
Data correspond to usage on the plateform after 2015. The current usage metrics is available 48-96 hours after online publication and is updated daily on week days.
Initial download of the metrics may take a while.