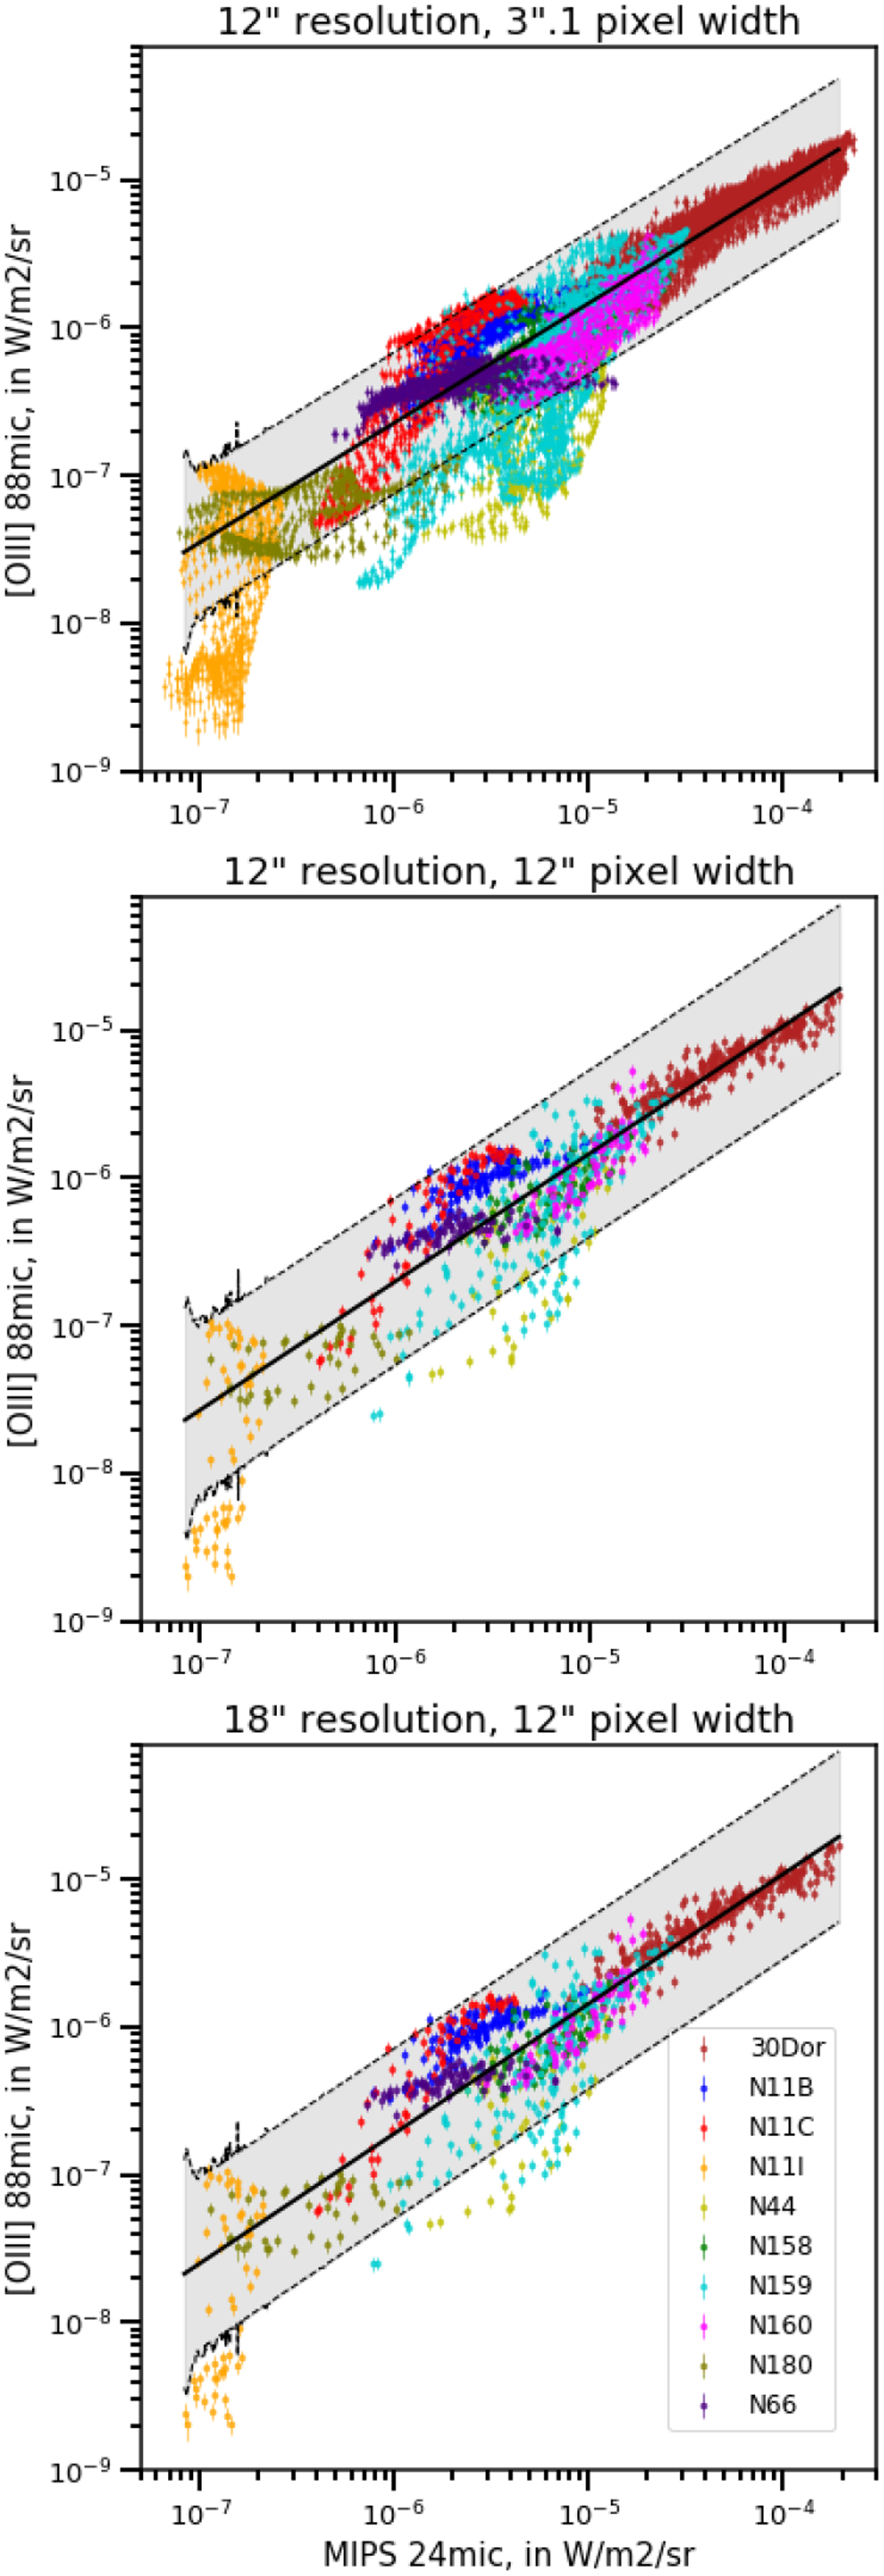
Fig. B.2
Download original image
The fitted linear relation and the corresponding data for the different resolution and sampling of the maps. The black solid line is the fit, the dashed black lines and gray filling illustrate the 95% confidence interval. The upper right panel, corresponding to 12" resolution and a pixel size of 12", is identical to the Figure 1 in Section 3.1, showing the fit of the correlation.
Current usage metrics show cumulative count of Article Views (full-text article views including HTML views, PDF and ePub downloads, according to the available data) and Abstracts Views on Vision4Press platform.
Data correspond to usage on the plateform after 2015. The current usage metrics is available 48-96 hours after online publication and is updated daily on week days.
Initial download of the metrics may take a while.