Fig. 2
Download original image
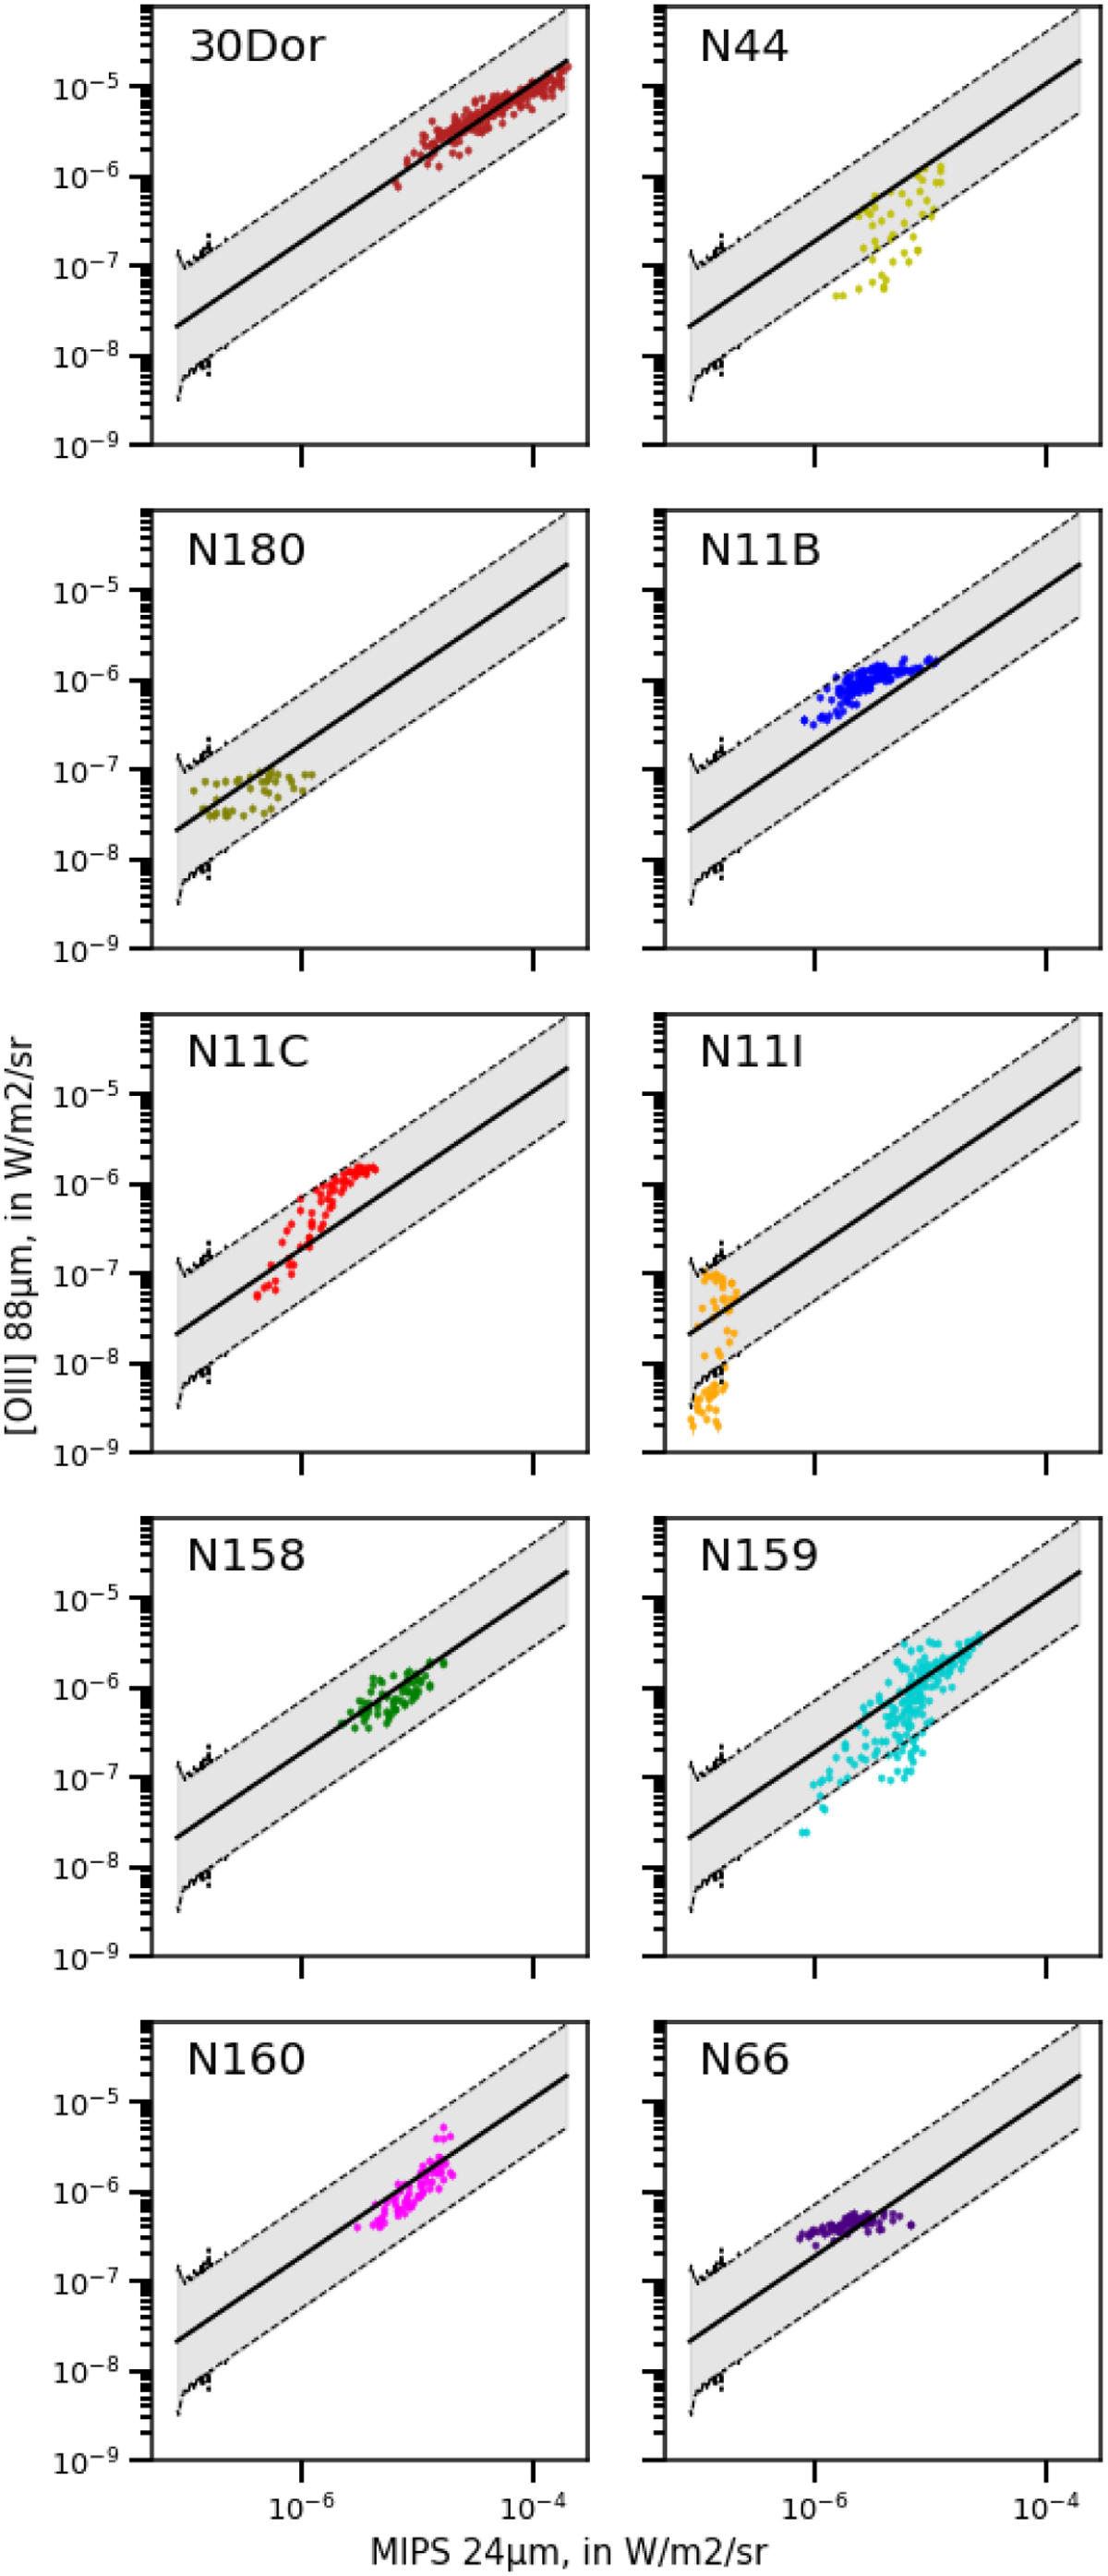
Relation between surface brightness of [O iii] and 24 µm for all of the pixels of our individual star-forming regions detected at more than 5σ. The black solid line represent the fitted linear relation in loglog space for the total sample (Fig. 1), and the dashed lines and gray filling represents the 95% confidence interval associated with the total sample.
Current usage metrics show cumulative count of Article Views (full-text article views including HTML views, PDF and ePub downloads, according to the available data) and Abstracts Views on Vision4Press platform.
Data correspond to usage on the plateform after 2015. The current usage metrics is available 48-96 hours after online publication and is updated daily on week days.
Initial download of the metrics may take a while.