Fig. 19
Download original image
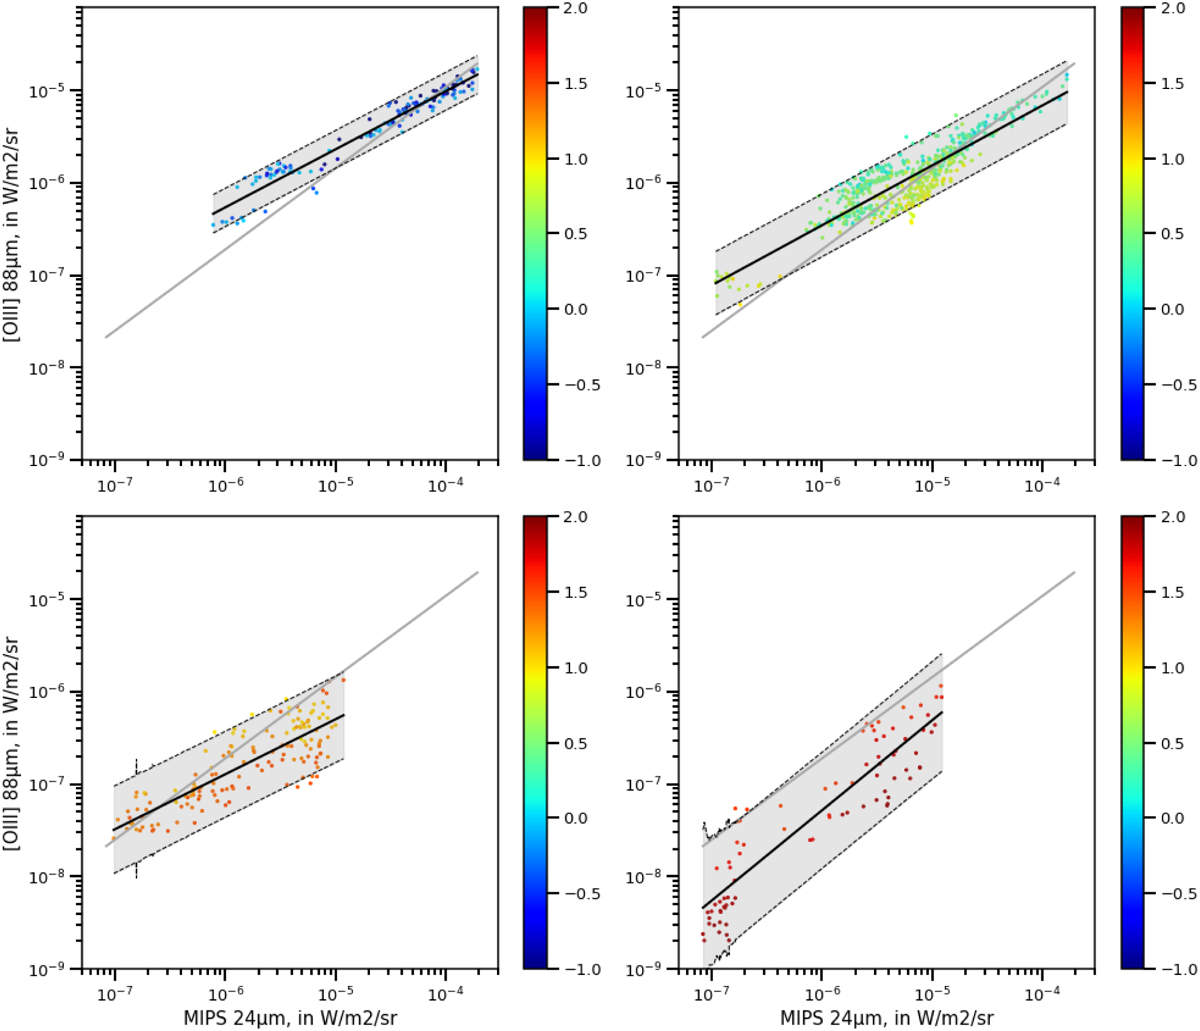
Relation between [O iii] and MIPS 24 µm. The points are color-coded with the value of log(cPDR). The different panels correspond to the four bins applied on log(cPDR), namely [-1,0] (upper left panel), [0,1] (upper right panel), [1,1.5] (lower left panel), [1.5,2] (lower right panel). The black solid line for each panel correspond to the fitted relation on the bin, the black dashed lines represent the 95% confidence interval, and the gray solid line is the relation fitted in Fig. 1 (Sect. 3.1).
Current usage metrics show cumulative count of Article Views (full-text article views including HTML views, PDF and ePub downloads, according to the available data) and Abstracts Views on Vision4Press platform.
Data correspond to usage on the plateform after 2015. The current usage metrics is available 48-96 hours after online publication and is updated daily on week days.
Initial download of the metrics may take a while.