Fig. 16
Download original image
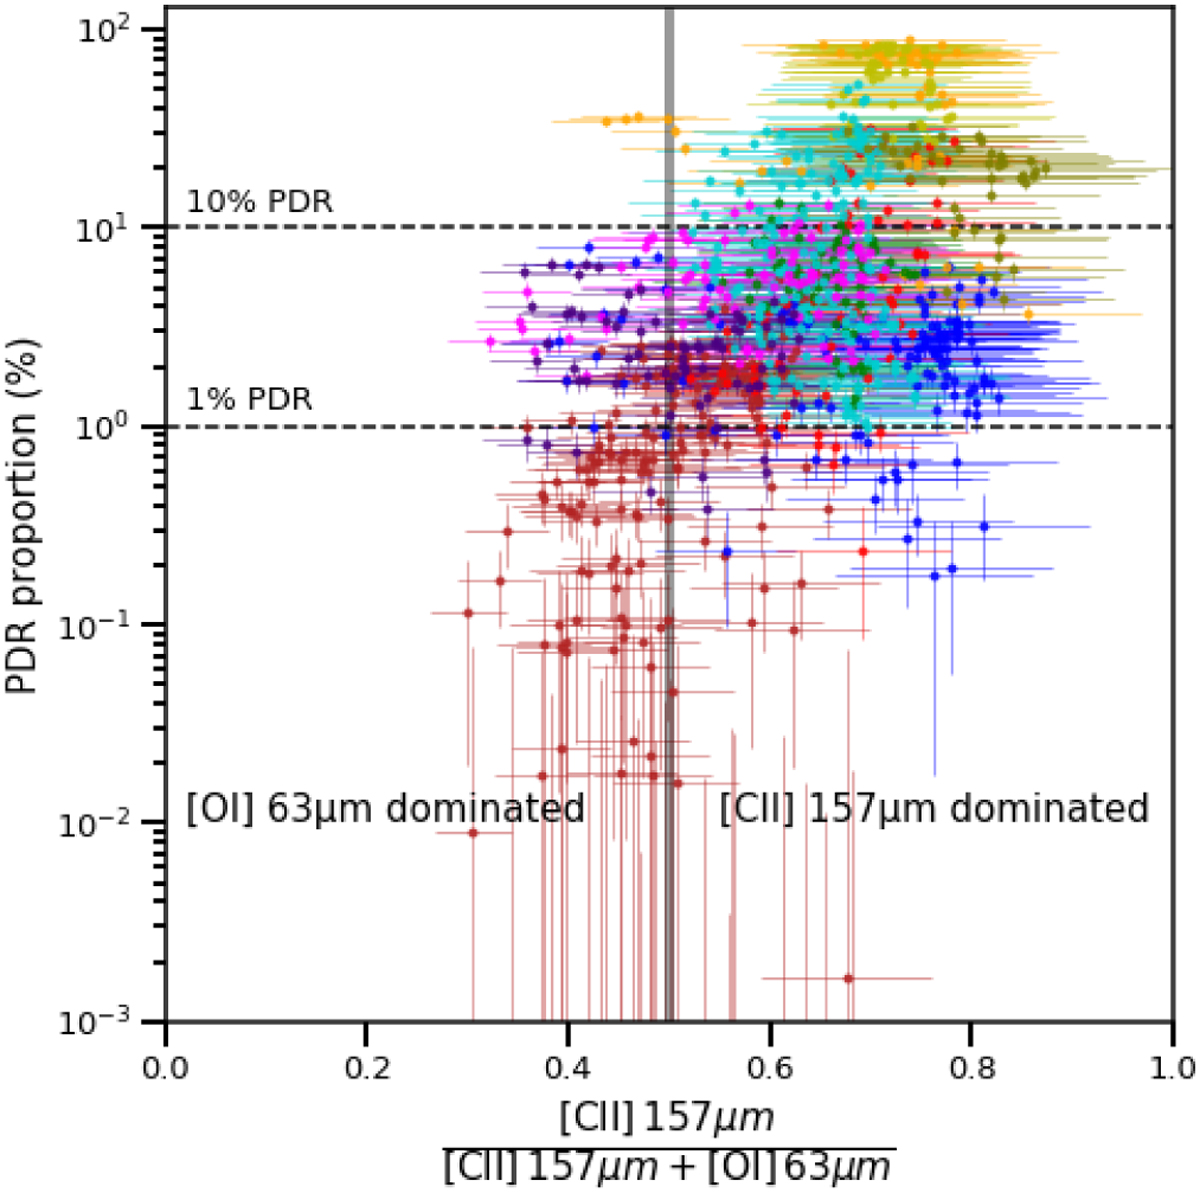
Relation between the PDR proportion and the ratio [C ii]/([C ii]+[O i]), for all of the pixels in all of the regions studied here, with the same region color code as in Fig. 1. The 1% and 10% cPDR values are indicated by the two dashed horizontal lines. The vertical gray line separates regions where cooling is dominated by [C ii] (right) and regions where the cooling is dominated by [O i] (left).
Current usage metrics show cumulative count of Article Views (full-text article views including HTML views, PDF and ePub downloads, according to the available data) and Abstracts Views on Vision4Press platform.
Data correspond to usage on the plateform after 2015. The current usage metrics is available 48-96 hours after online publication and is updated daily on week days.
Initial download of the metrics may take a while.