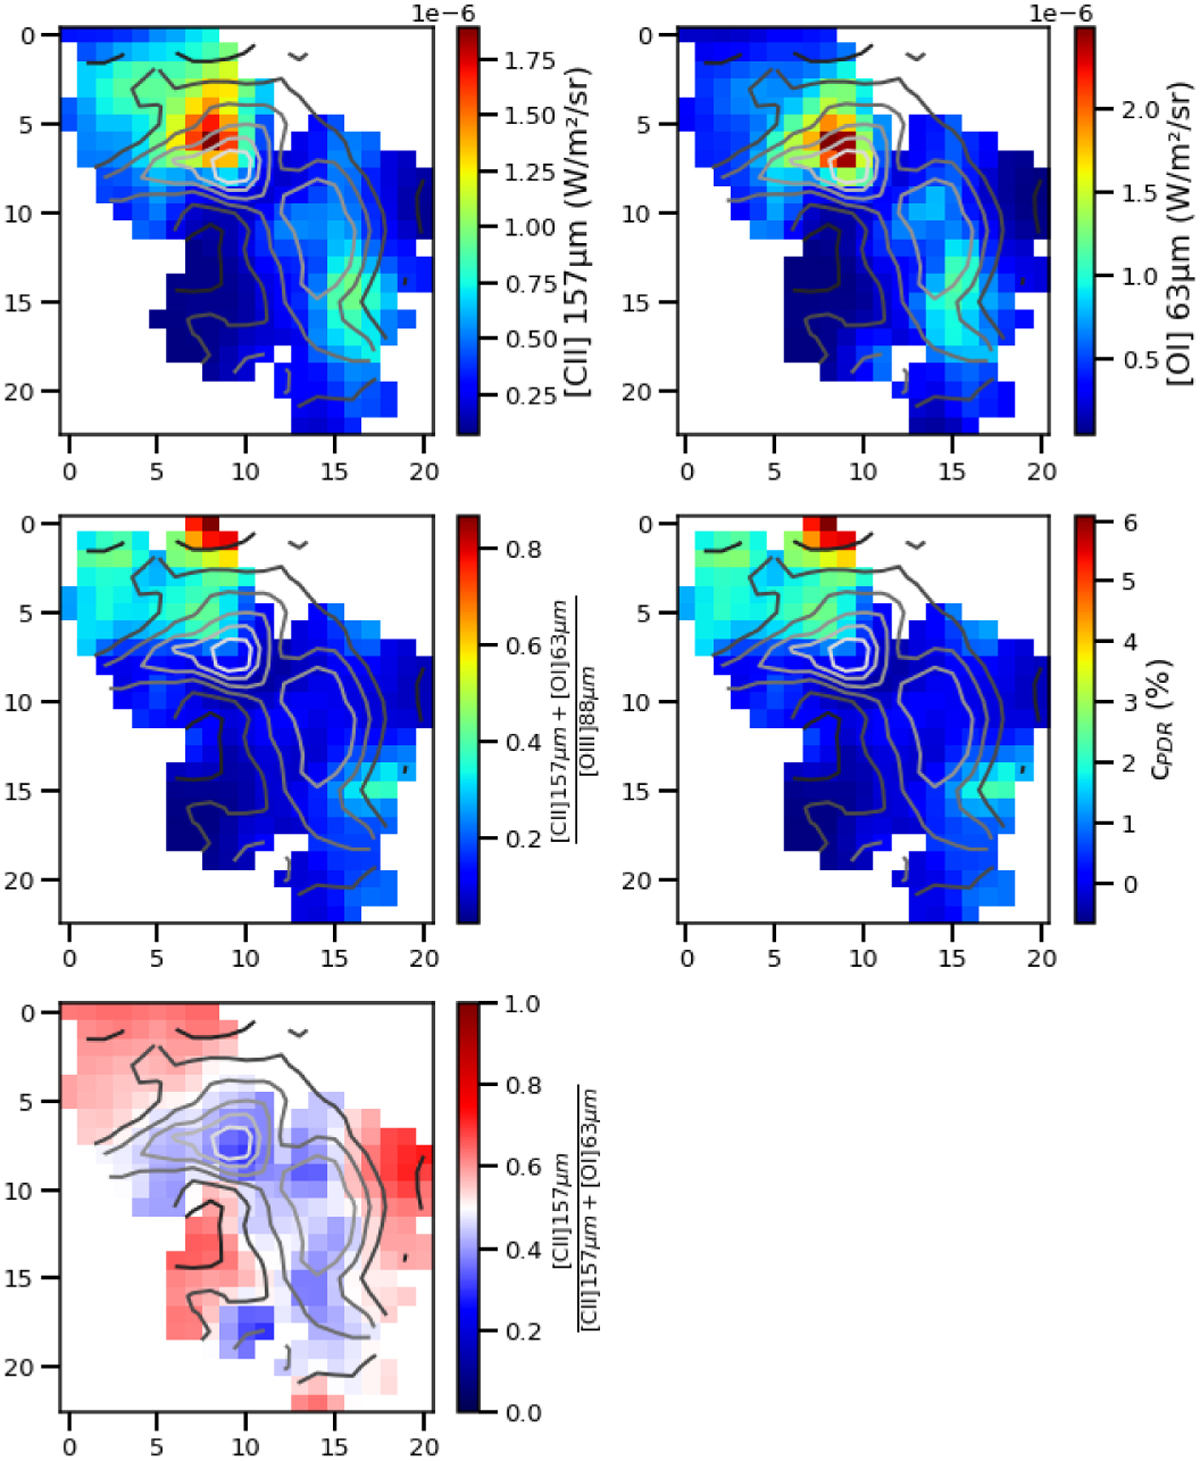
Fig. 14
Download original image
Distribution of [C ii] and [O i] emission (upper left and right panels respectively) in 30 Doradus; the ratio of ([C ii]+[O i])/[O iii] (middle left panel), the distribution of cPDR (middle right panel) with the colorbar indicating the percentage of PDR along the line of sight and the ratio [C ii]/([C ii]+[O i]) (lower panel). The contours of [O iii] are overlaid on all the panels for comparison, with the color intensity ranging from dark gray for lower emission to light gray for higher [O iii] emission.
Current usage metrics show cumulative count of Article Views (full-text article views including HTML views, PDF and ePub downloads, according to the available data) and Abstracts Views on Vision4Press platform.
Data correspond to usage on the plateform after 2015. The current usage metrics is available 48-96 hours after online publication and is updated daily on week days.
Initial download of the metrics may take a while.