Fig. 12
Download original image
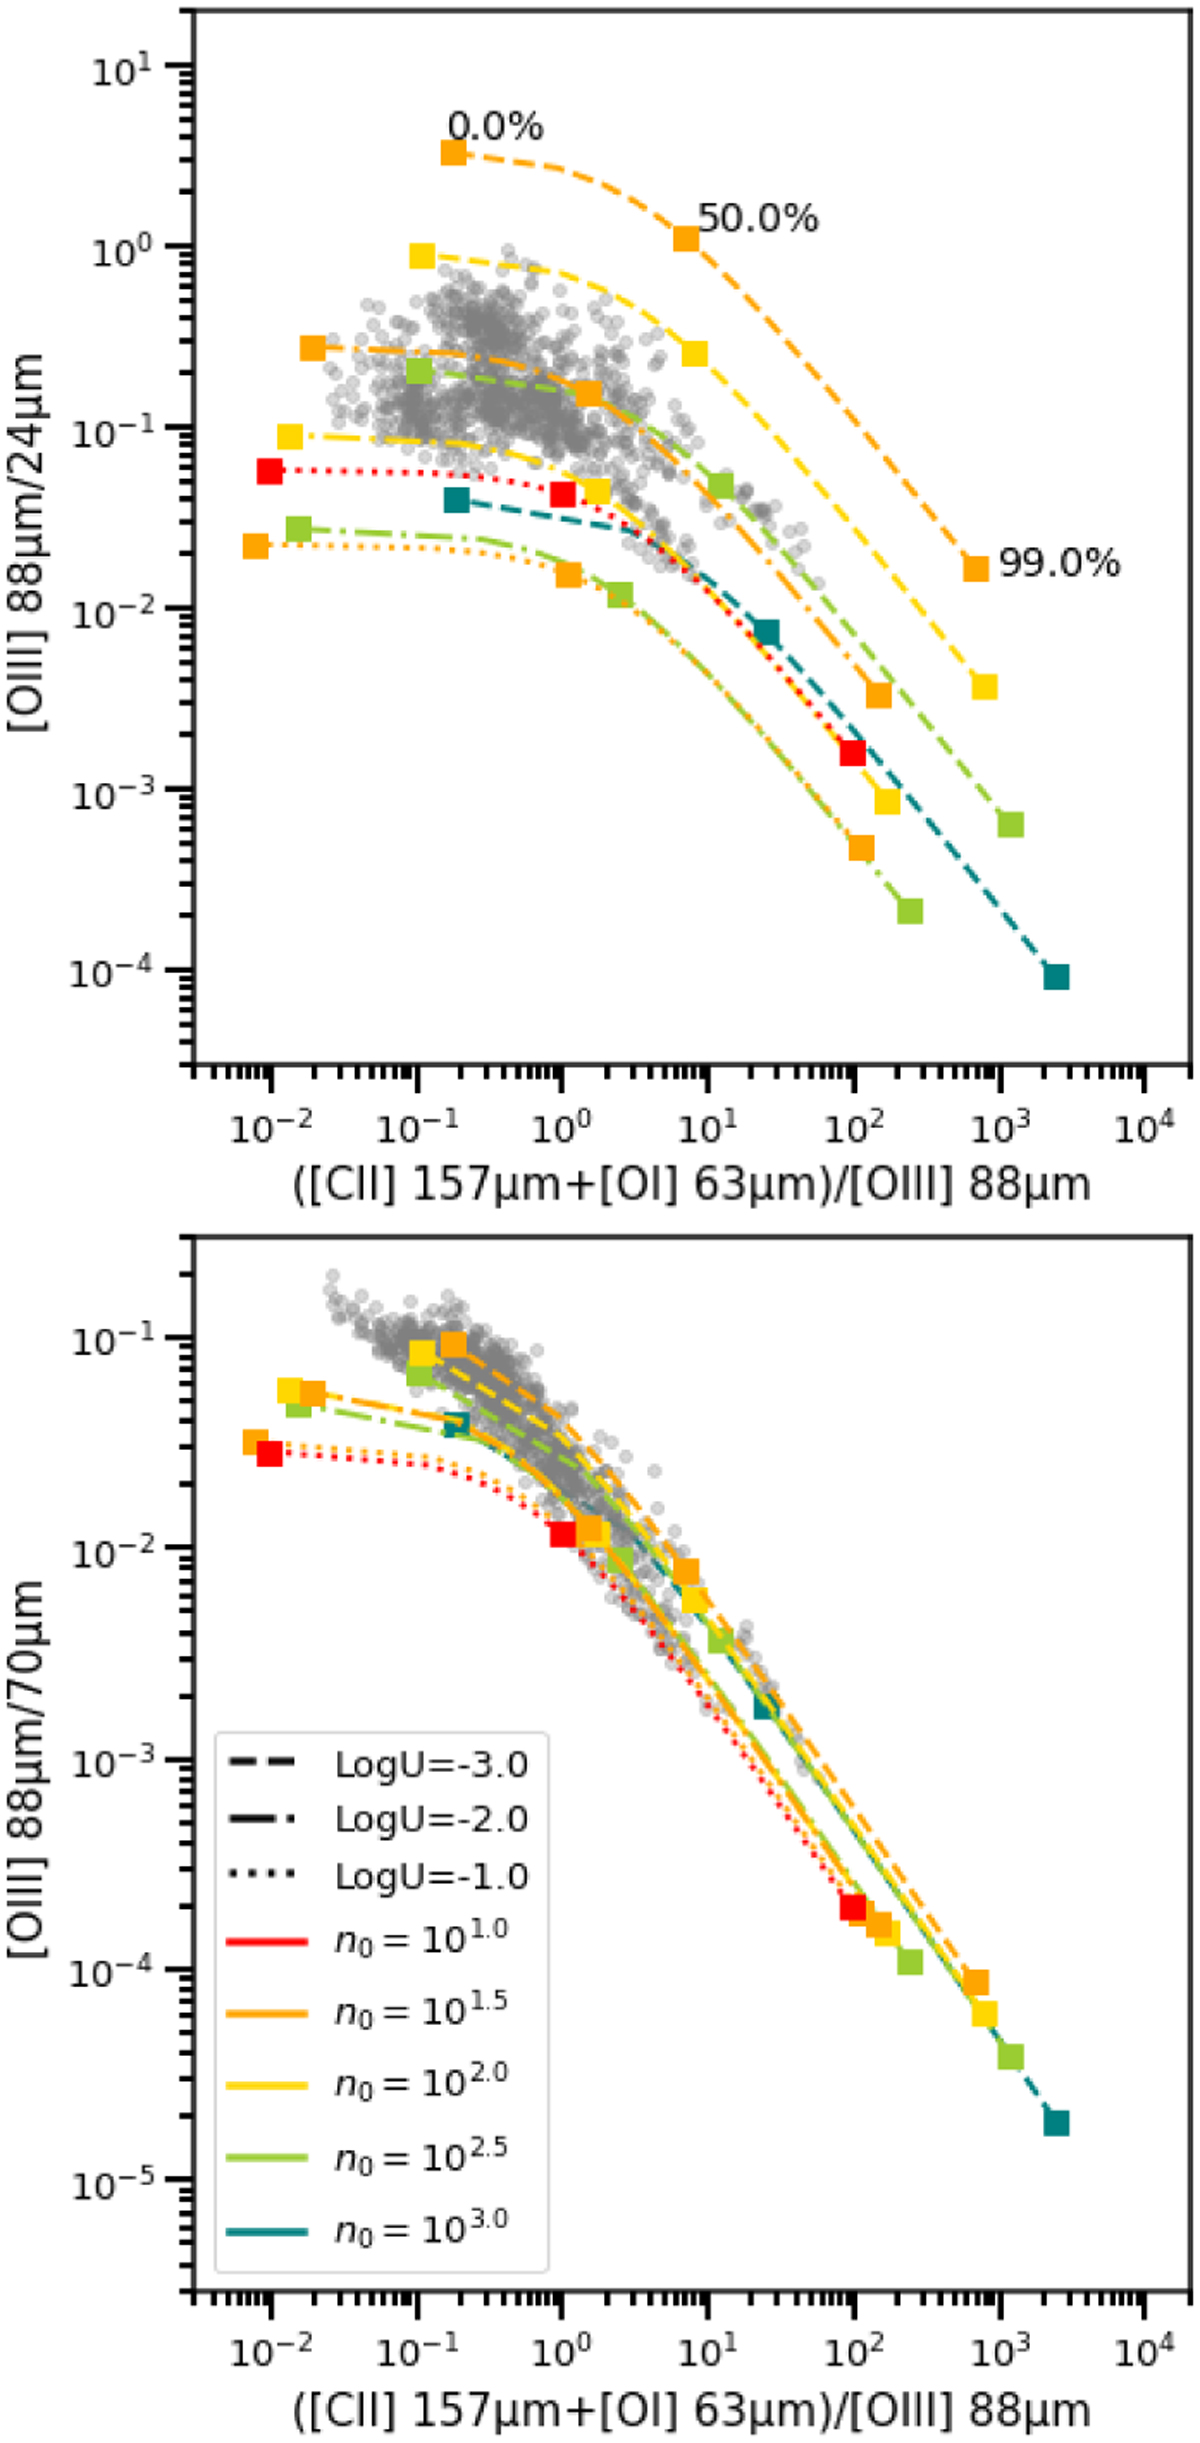
Representation of the data of the full sample and models with constant pressure for [O iii] 88 µm/MIPS 24 µm as a function of ([C іі]+[O i])/[O iii] (top panel), and [O iii] 88 µm/MIPS 70 µm as a function of ([C ii]+[O i])/[O iii] (lower panel). Each model is represented with a color for the initial density, n0, and a line style for U, and the lines follow the cPDR, with the markers representing the proportions of 0%, 50% and 99%. The models displayed are calculated for an age of star-forming burst of 4 Myr. The gray points are the observed values for each pixel of the regions.
Current usage metrics show cumulative count of Article Views (full-text article views including HTML views, PDF and ePub downloads, according to the available data) and Abstracts Views on Vision4Press platform.
Data correspond to usage on the plateform after 2015. The current usage metrics is available 48-96 hours after online publication and is updated daily on week days.
Initial download of the metrics may take a while.