Fig. 11
Download original image
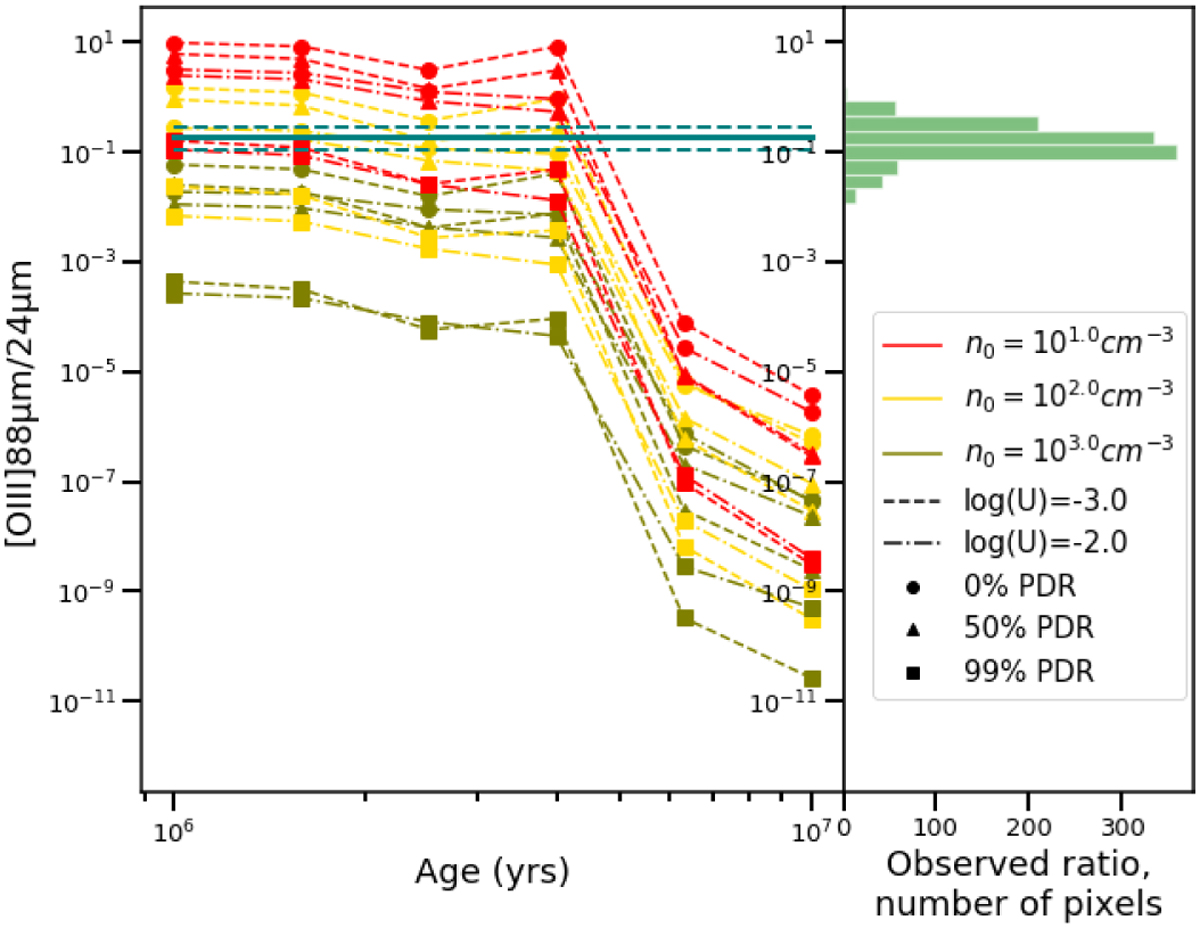
[O iii]/24 µm for different models as a function of burst age. Each model is represented with a color for n0, and a line style for U, and the lines are following the proportion of PDR emission, cPDR, with the markers representing the cPDR of 0%, 50 % and 99%. The blue solid horizontal line corresponds to the median of the spatially resolved observations and the dashed blue lines to the median absolute deviation. The distribution of our observations is shown on the right as a histogram.
Current usage metrics show cumulative count of Article Views (full-text article views including HTML views, PDF and ePub downloads, according to the available data) and Abstracts Views on Vision4Press platform.
Data correspond to usage on the plateform after 2015. The current usage metrics is available 48-96 hours after online publication and is updated daily on week days.
Initial download of the metrics may take a while.