Fig. 10
Download original image
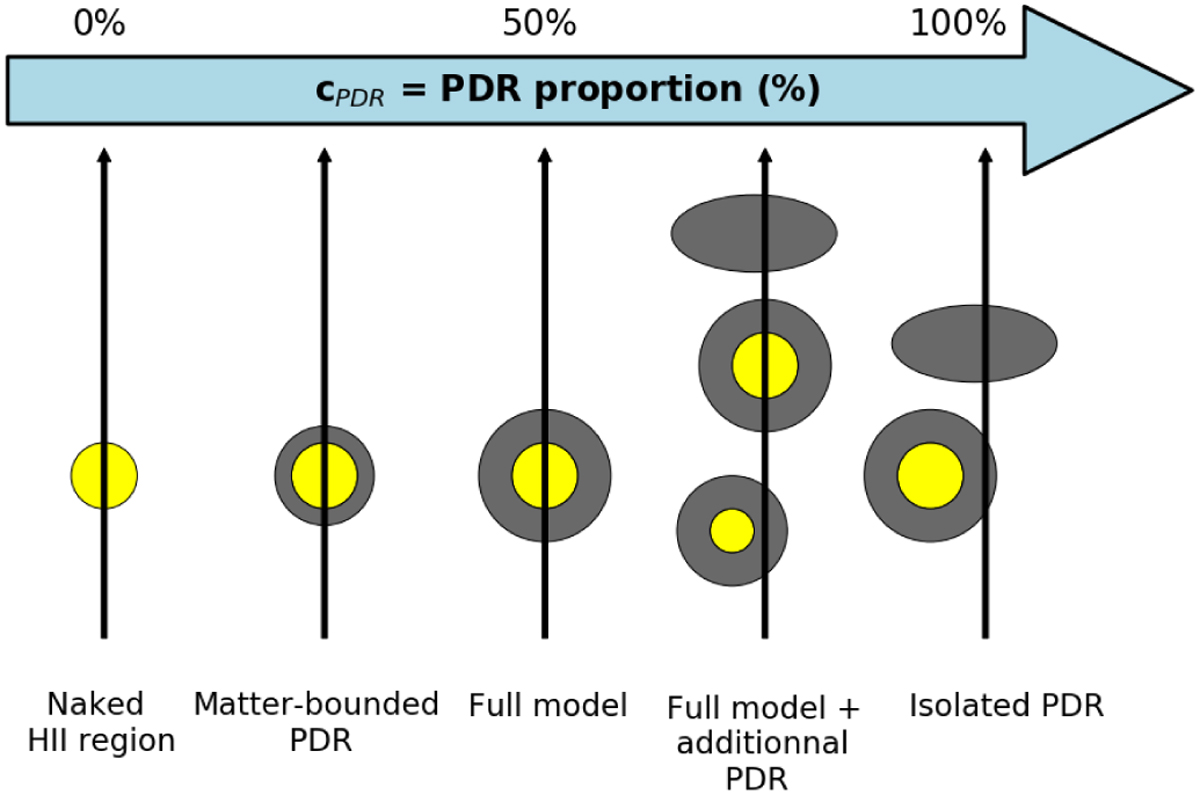
Sketch of different PDR proportions (cPDR) in our mixed models. The yellow regions represent H ii regions, and PDRs are represented in gray. The blue arrow indicates the direction of increasing cPDR. The black arrows show the lines of sight through the represented clouds (each line of sight representing a given pixel in our maps). As per Eq. (4), the 0% cPDR case corresponds to no PDR in the model, hence fully ionized gas; 50% cPDR corresponds to a single Cloudy model, with a connected H ii region and PDR (Eq. (A.2)); and 100% cPDR represents a full PDR model, without an H ii region contribution. We note that 50% of PDR does not correspond to a medium with half of the volume being filled by PDR, but corresponds to a mix that can be modeled by a Cloudy model with a full PDR layer.
Current usage metrics show cumulative count of Article Views (full-text article views including HTML views, PDF and ePub downloads, according to the available data) and Abstracts Views on Vision4Press platform.
Data correspond to usage on the plateform after 2015. The current usage metrics is available 48-96 hours after online publication and is updated daily on week days.
Initial download of the metrics may take a while.