Open Access
Fig. 21
Download original image
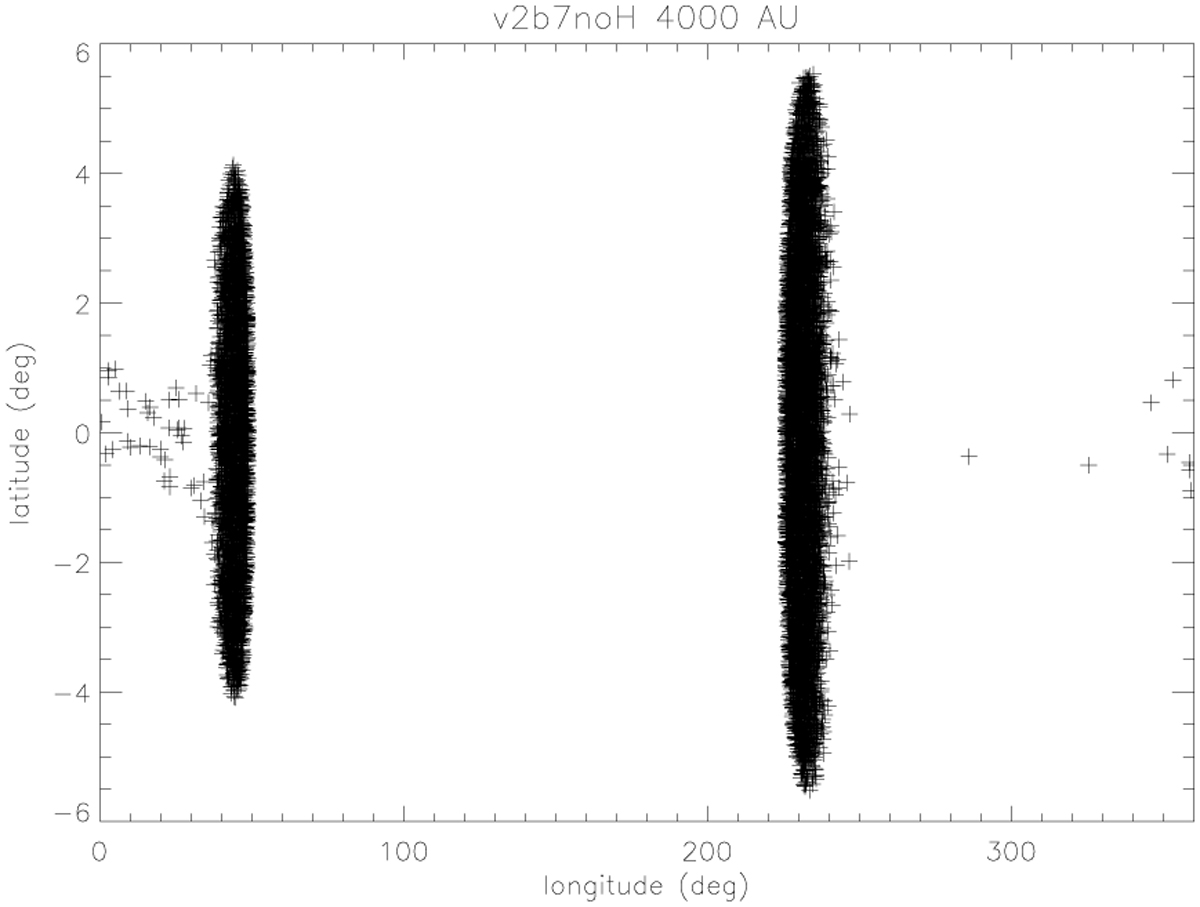
Longitude-latitude distribution of the flow lines crossing points on a sphere with a radius of 4000 AU and the centre at the host star for the case V = 2 km s−1, B = 7 µG, nH,IS = 0.001 cm−3 (model 7). In addition to the R and L streams, there are a few crossing points in the tail region (less than 1% of the total flux).
Current usage metrics show cumulative count of Article Views (full-text article views including HTML views, PDF and ePub downloads, according to the available data) and Abstracts Views on Vision4Press platform.
Data correspond to usage on the plateform after 2015. The current usage metrics is available 48-96 hours after online publication and is updated daily on week days.
Initial download of the metrics may take a while.