Fig. 2
Download original image
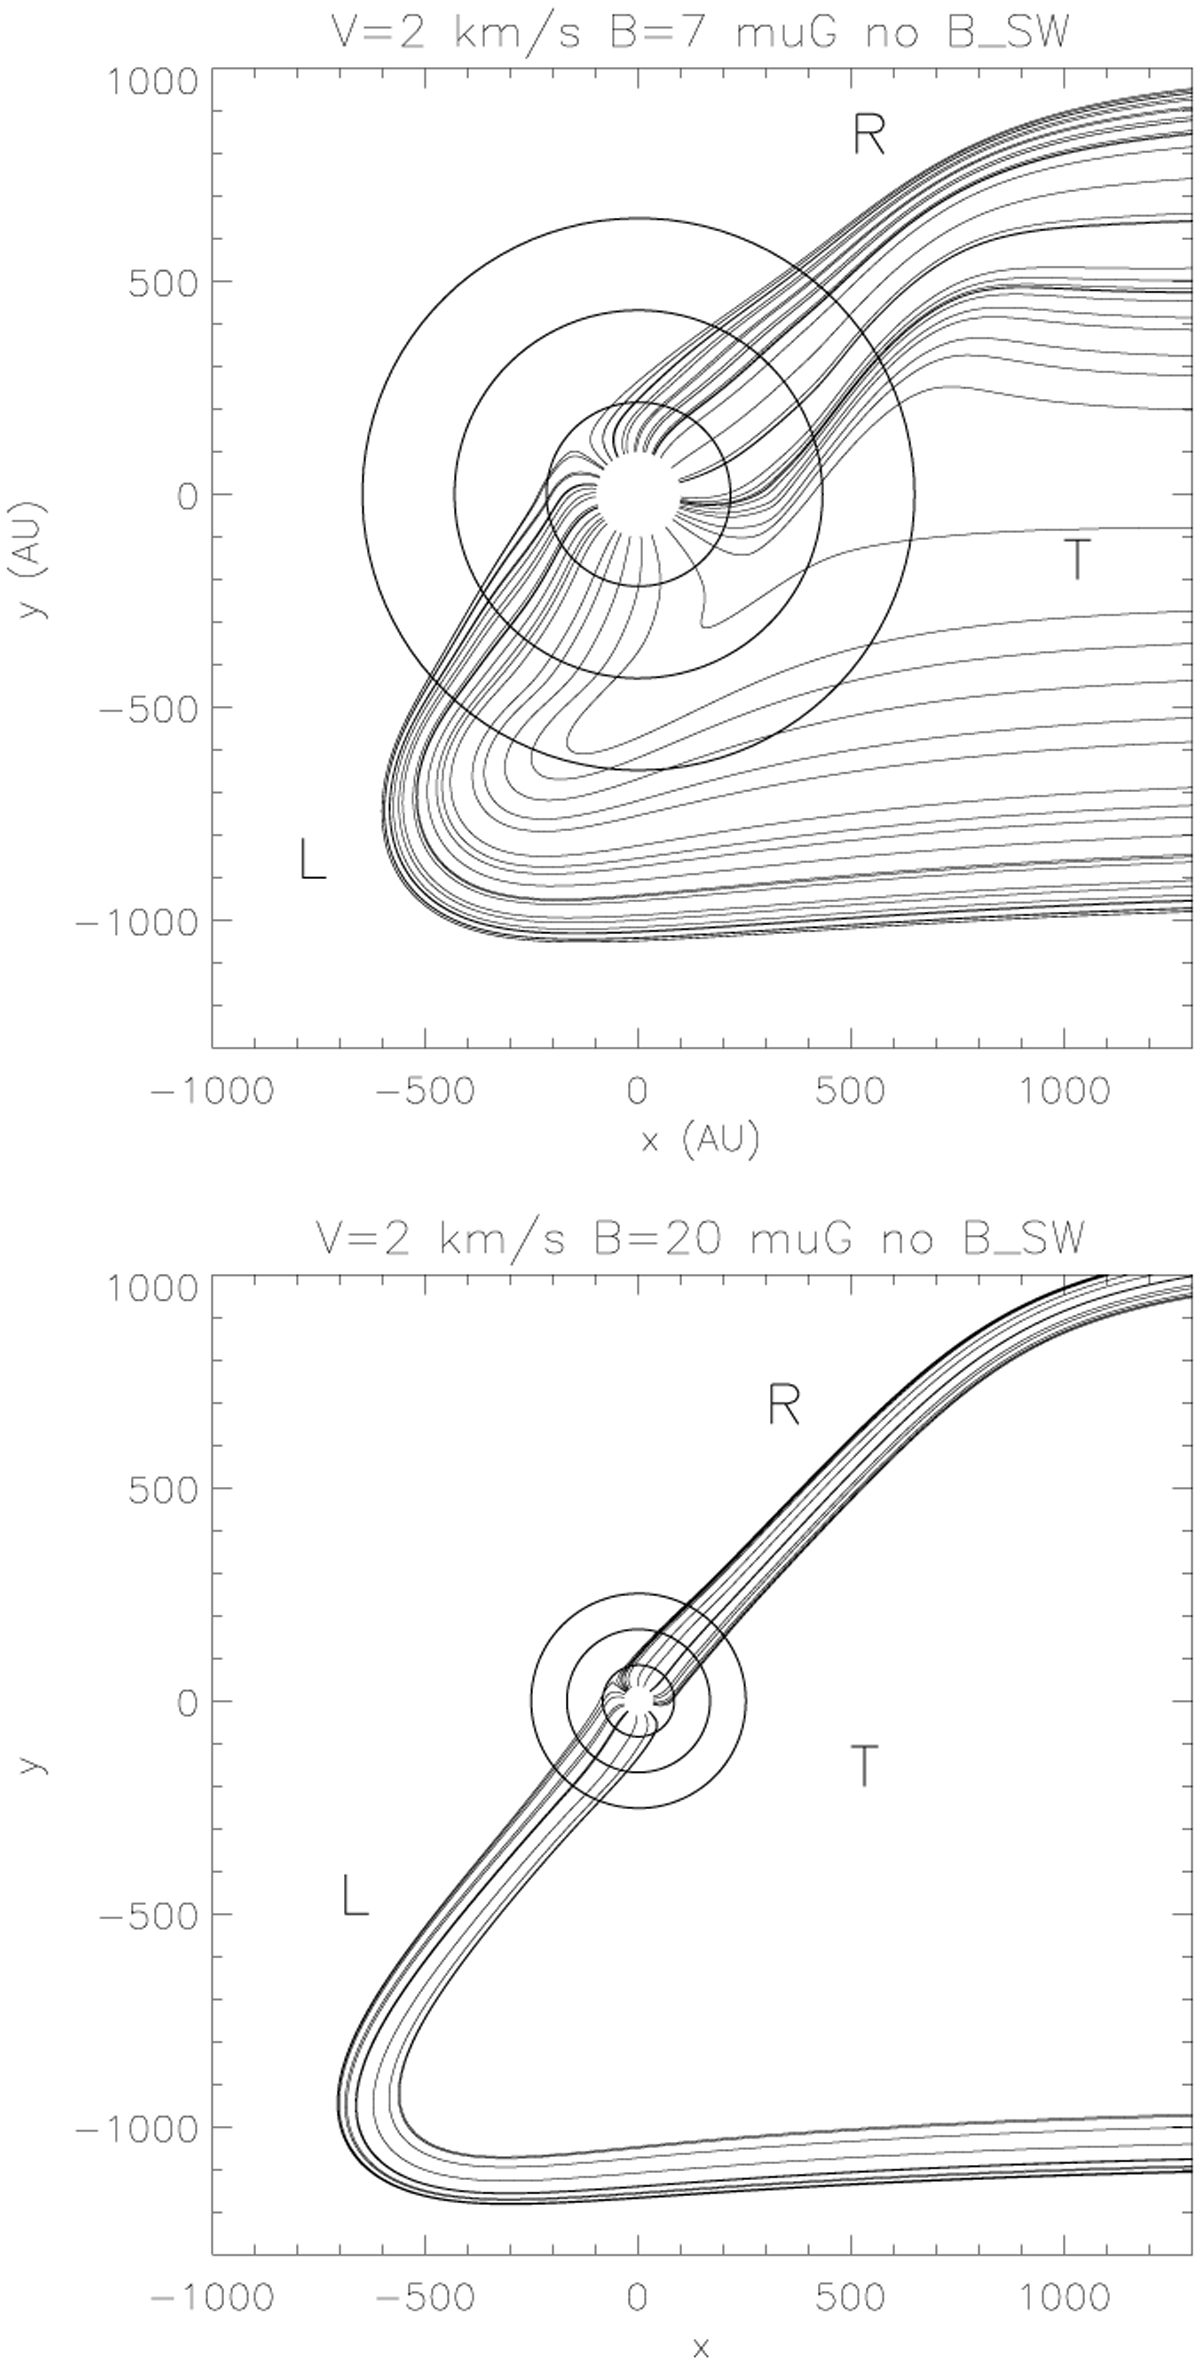
Selected flow lines near the (B, V) plane for the cases with V = 2 km s−1, B = 7 µG, (model 5, upper panel), and V = 2 km s−1, B =20 µG, (model 17, lower panel). The two-stream structure of the stellar plasma flow (L and R streams) and the possible tail region (T) are indicated. The circles indicate the distances of 2 RTS, 4 RTS, and 6 RTS from the star, where RTS is the distance to the termination shock.
Current usage metrics show cumulative count of Article Views (full-text article views including HTML views, PDF and ePub downloads, according to the available data) and Abstracts Views on Vision4Press platform.
Data correspond to usage on the plateform after 2015. The current usage metrics is available 48-96 hours after online publication and is updated daily on week days.
Initial download of the metrics may take a while.