Fig. 10
Download original image
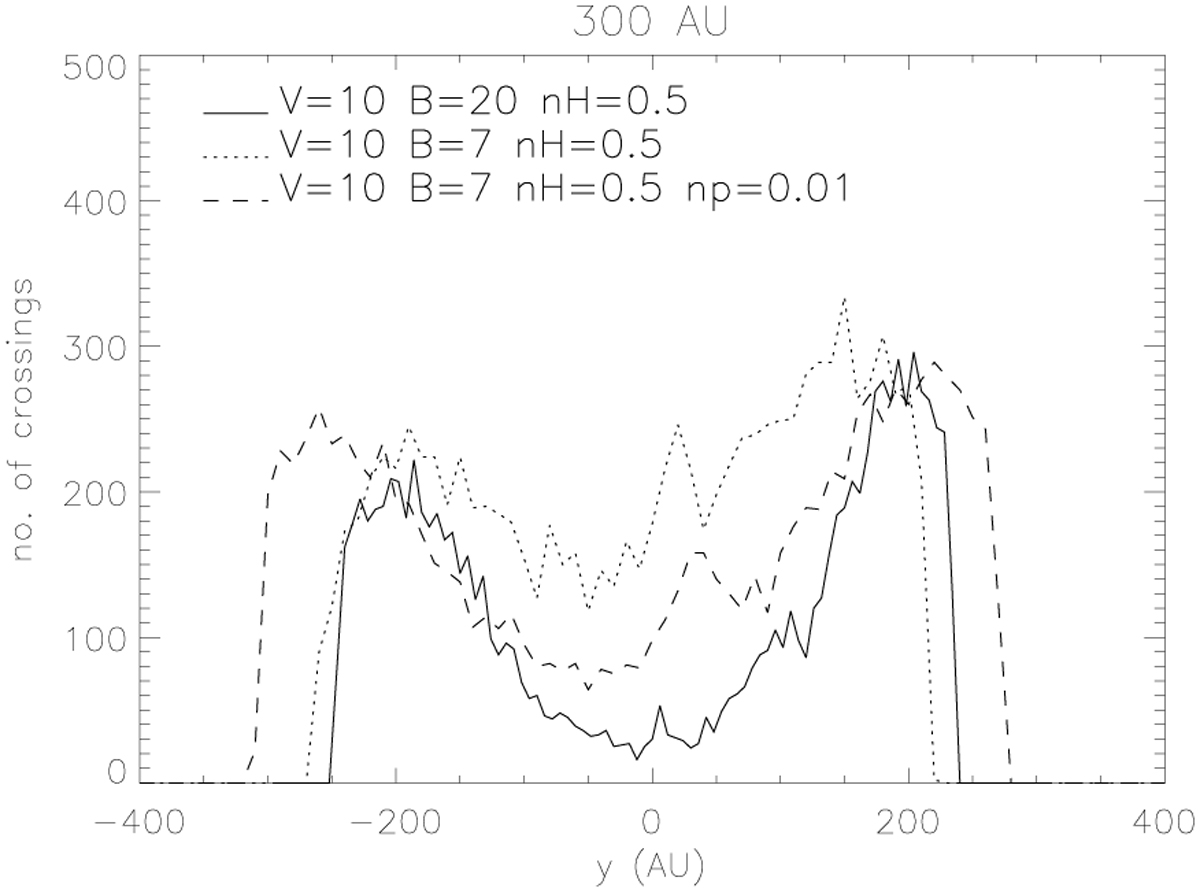
Number of the flow lines that cross the plane x = 300 AU plotted vs the coordinate y (see Fig. 1) for an ISM neutral density nH,IS = 0.5 cm−3. The following cases are shown: V = 10 km s−1, B =20 µG, np,IS =0.06 cm−3 (model 21, solid line), V = 10 km s−1, B = 7 µG, np,IS =0.06cm−3 (model 12, dotted line), and V = 10 km s−1, B = 7 µG, np,IS =0.01 cm−3 (model 13, dashed line).
Current usage metrics show cumulative count of Article Views (full-text article views including HTML views, PDF and ePub downloads, according to the available data) and Abstracts Views on Vision4Press platform.
Data correspond to usage on the plateform after 2015. The current usage metrics is available 48-96 hours after online publication and is updated daily on week days.
Initial download of the metrics may take a while.